Ieva Karvelyte, University College London
The rising prevalence of mental health conditions among children and young adults accelerated by the COVID-19 pandemic emphasises the urgent need to address this issue effectively. A potential avenue for early diagnosis lies in physical activity patterns as individuals with mental health conditions often move less than the general population. This paper utilises Millennium Cohort Study data to investigate the relationship between childhood physical movement patterns, and mental distress and wellbeing outcomes in late adolescence. By controlling for a range of factors of both cohort members and their parents, the study employs well-adjusted logistic and linear regressions to assess the hypothesis. Objective physical movement data is collected with accelerometers, while mental distress is measured using the Kessler K6 scale and mental wellbeing using the Warwick–Edinburgh Mental Wellbeing Scale. The findings of the study suggest no significant association between raw physical movement and mental distress; however, there is suggestive evidence of a weak positive association with mental wellbeing. In addition, the study found that lower exercise levels at age 7 were associated with an increased likelihood of mental distress at age 17, highlighting the potential impact of exercise habits on mental health in adolescence. Overall, these findings suggest that raw physical activity data may be a better predictor of specific mental health outcomes, such as those assessed by the Strengths and Difficulties Questionnaire in similar studies. The paper offers recommendations for future research – such as using self-reported questionnaires to contextualise quantitative physical movement data – and a more comprehensive analysis of the cognitive and mental implications.
Keywords: Physical activity impact on mental health, longitudinal physical and mental health research, Millennium Cohort Study, childhood physical movement patterns and adolescent mental wellbeing, Kessler K6, Warwick–Edinburgh Mental Wellbeing Scale.
The prevalence of mental health conditions among children in England has shown a significant increase, with one in six children aged 6–16 now expected to have a mental health condition, compared to one in nine children in 2017 (NHS Digital, 2021). The impact of the coronavirus pandemic has negatively contributed to this trend, as more than 39 per cent of surveyed children experienced a deterioration in their mental health over four years, highlighting the urgent need for early intervention and support (NHS Digital, 2021).
Research has shown that individuals diagnosed with mental health conditions tend to engage in less physical activity compared to the general population (Schuch et al., 2016: 140; Stubbs et al., 2016: 432). Likewise, lower physical activity levels and increased sedentary behaviour have been associated with poor mental health, obesity and cardiovascular diseases in children and adolescents (Janssen and LeBlanc, 2010: 3). However, studies investigating the association between physical activity and mental health outcomes have yielded varying results, partly due to differences in study design and measurement approaches. Some studies rely on self-reported questionnaires to assess both physical activity and mental health (Ashdown-Franks et al., 2017: 20; Birkeland et al., 2009: 28; Brunet et al., 2013: 26; Hoegh Poulsen et al., 2016: 2; Jewett et al., 2014: 641), while others employ structured interviews and observations to diagnose mental health conditions (Jerstad et al., 2010: 269; Ströhle et al., 2007: 1660; Toseeb et al., 2014: 1095). To provide a more objective and accurate measure of physical activity, accelerometers have been used in recent studies (Reilly et al., 2008: 614). First investigated in the 1950s, accelerometers are often used in epidemiological research as they can be conveniently attached to wrists, thighs or ankles. They measure of objects in motion along reference frames (Yang and Hsu, 2010: 7773) in Euclidean Norm Minus One (ENMO), a mean acceleration in gravitational units (mg), providing a single value representing vector movement in three-dimensional space. Still unprotected from the Hawthorne Effect (change in behaviour due to being observed), accelerometers prove to be more objective than self-reported questionnaires, which are prone to selective recall, underestimation or overestimation (Althubaiti, 2016: 212).
A previous study utilising accelerometers has examined physical activity levels at ages 12–13 and assessed mental health outcomes at ages 15–16 using measures such as the Strengths and Difficulties Questionnaire (SDQ) and the Warwick–Edinburgh Mental Wellbeing Scale (WEMWBS) (Bell et al., 2019: 3). Another study using data from earlier sweeps of the Millennium Cohort Study (MCS4 & MCS5) employed linear regression analysis to reveal that increased physical activity was associated with fewer peer problems in both boys and girls (Ahn et al., 2017: 96). Additionally, sedentary time was linked to fewer hyperactivity symptoms but more peer problems. It is worth considering that these studies might have been limited in capturing mental disorders due to the young age of participants and the measurement tools employed (SDQ and WEMWBS). Nevertheless, they successfully incorporated objective physical activity measurements and aimed to explore the potential relationship between physical activity and mental health outcomes in children and adolescents.
Building upon previous research, this paper extends the investigation by incorporating additional data from the Millennium Cohort Study (MCS) collected at age 17 (MCS7). Utilising both linear and logistic regression analyses, it explores the connection between childhood physical activity and mental distress as well as wellbeing outcomes during adolescence for MCS participants in Scotland, Wales, Northern Ireland and England. The study controls for multiple confounding factors associated with both children and their parents. The independent variable is derived from objective movement data collected via accelerometers, while the dependent outcome variables consist of non-specific mental distress assessed using the Kessler K6 scale, and general wellbeing evaluated through the WEMWBS.
The data used for the analysis is from the Millennium Cohort Study (MCS), conducted by the Centre for Longitudinal Studies (CLS). The MCS observes the lives of 18,818 children born in the UK over a 17-month period from September 2000 to January 2002, with an additional 701 children included in subsequent sweeps (Fitzsimons et al., 2020b: 8).
At the time of the writing, there have been seven sweeps of the MCS, with gathered information on cohort members and their parents. For this analysis, data from MCS4 (аged 7), MCS6 (age 14), and MCS7 (age 17) are utilised. MCS4 was conducted in mid-childhood, focusing on schooling, health, childcare, education, and social and family circumstances (CLS, 2020: 4). MCS6 delved into more sensitive topics, including risky behaviours like alcohol, smoking and drug use, as well as antisocial activities, contact with law enforcement, puberty, romantic relationships and sexual behaviour (Fitzsimons et al., 2020a: 5). MCS7 was conducted at a pivotal time in teenagers’ lives, when choices regarding schooling, further education, training, work and living at home were made (Fitzsimons et al., 2020b: 9). Additionally, an emphasis was put on mental health as well as social, emotional and cognitive development using the Kessler K6 scale and WEMWBS measures.
Throughout the course of the MCS, the proportion of productive cases – those contributing valuable and relevant information at each sweep – has decreased from 96.4 per cent to 55.2 per cent (Fitzsimons et al., 2020b: 78). Non-random attrition is a common occurrence in birth cohort studies due to factors such as refusal, relocation, death and other reasons. To ensure the representativeness of the data remains intact, survey weights provided in the dataset are used. In this study, only the first child of the family is included, meaning 150 cases of twin siblings are excluded due to shared genetic and environmental factors that could potentially bias the analysis and violate the assumption of independence. As a result, the final working sample consists of 10,614 cohort members.
This study utilised available data from the MCS and conducted a comprehensive review of relevant peer-reviewed literature (Aggio et al., 2016; Ahn et al., 2017; Bell et al., 2019; Ohrnberger et al., 2017) to select confounding, dependent and independent variables. To ensure the integrity of the working sample, certain confounding variables were excluded due to a significant number of missing observations. The wellbeing score was derived from a shortened version of the Rosenberg Self-Esteem Scale (Fitzsimons et al., 2020a: 36), allowing for an assessment of participants’ overall psychological wellbeing. The cognitive score was obtained by combining data from two assessments: the Cambridge Gambling Task, which evaluates decision-making and risk-taking behaviour, and the Word Activity, which measures respondents’ understanding of word meanings (Fitzsimons et al., 2020a: 36). Body Mass Index (BMI) was calculated using height and weight measurements taken by the interviewer using a Leicester height measure and Tanita scales, respectively. Body fat percentage was measured by sending a weak electronic current through the body during the weight measurement (Fitzsimons et al., 2020b: 66).
To capture valuable insights into parental influence, data about parents’ physical activity levels, self-assessment of general health, education level (evaluated on a standardised NVQ scale), income level and continuous employment status since the previous sweep were collected. In addition, reading activities involving the child were included as an indicator of parental attention and active involvement in the child’s cognitive development. For a comprehensive overview of the confounding variables and their respective sources, please refer to Table 1, which details the identification and measurement sources from MCS4, MCS6 and MCS7.
| Variable | Type (measurement) |
| COHORT MEMBER DATA | |
| Dependent variables | |
| Kessler K6 score (MCS7) | Discrete (0–24) |
| WEMWBS score (MCS7) | Discrete (7–35) |
| Independent variable | |
| Mean activity (MCS7) | Continuous (mg) |
| Confounders | |
| Sex (MCS7) | Categorical (1 – Male, 2 – Female) |
| Age (MCS7) | Continuous (year.month) |
| Wellbeing Score (MCS6) | Discrete (0–42) |
| Cognitive Score (MCS4) | Discrete (0–72) |
| Cognitive Score (MCS6) | Discrete (0–19) |
| BMI (MCS7) | Continuous (BMI score) |
| Body fat (MCS7) | Continuous (Body fat %) |
| Exercise habits (MCS4) | Ordinal (1 – Five or more days a week to 7 – Not at all) |
| PARENT DATA | |
| Activity (MCS7) | Ordinal (1 – Every day/almost every day to 7 – Less often/never) |
| General health (MCS4) | Ordinal (1 – Excellent to 5 – Poor) |
| General health (MCS7) | Ordinal (1 – Excellent to 5 – Poor) |
| Readingfor child (MCS7) | Ordinal (1 – Yes, easily to 3 – No) |
| Education (MCS7) | Ordinal (1 – National Vocational Qualification (NVQ) level 1 to 5 – NVQ level 5) |
| Income (MCS7) | Ordinal (2 – Less than £5000 (annually) to 20 – More than £140,000 (annually) |
| Continuous employment (MCS4) | Categorical (1 – Yes, 2 – No) |
| Continuous employment (MCS6) | Categorical (1 – Yes, 2 – No) |
The analysis was conducted using the R programming language, with an initial focus on inspecting correlations to detect potential multicollinearity issues and identify interesting patterns for further exploration. Initially, data from both parents were included in the analysis; however, high correlations among variables such as income, education levels and health necessitated the inclusion of only one parent’s data. The selected parent (indicated as the first parent in the survey) represented both parents in most cases, effectively addressing the issue of multicollinearity. Subsequently, no significant multicollinearity issues were observed after excluding variables related to the second parent from the analysis.
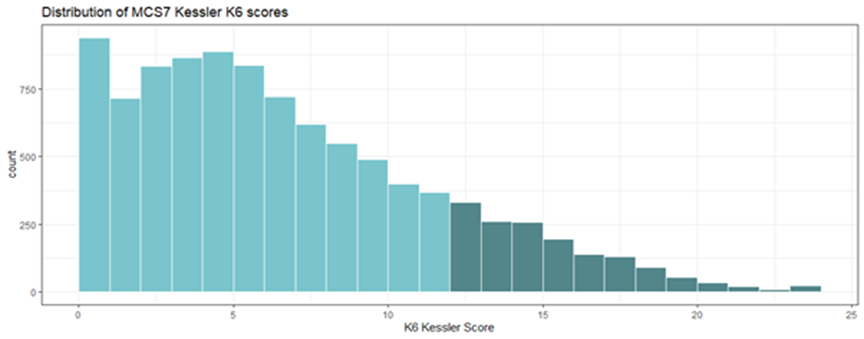
The primary dependent variable of interest was the Kessler K6 score, measured for cohort members in MCS7. K6 scale is a six-question scale estimating the prevalence of psychological distress from the individual’s experience in the last 30 days, focusing on the severity rather than a specific diagnosis (Kessler et al., 2010: 6). The total scores range from 0 to 24: K6 score of 0–12 indicates low to moderate distress, while 13–24 is considered high risk of psychological distress (Kessler et al., 2010: 7). The graph in Figure 1 revealed a semi-normal distribution with a right skew, meaning more respondents fell on the lower end of the psychological distress spectrum. Those in the higher risk group, with scores of 13 and above, were represented by the dark green portion of the graph. For binary logistic regression analysis, the K6 scale was dichotomised using the cut-off point. That means that study participants below the 13-point threshold were recoded as 0, while those with scores of 13 and above were recoded as 1.
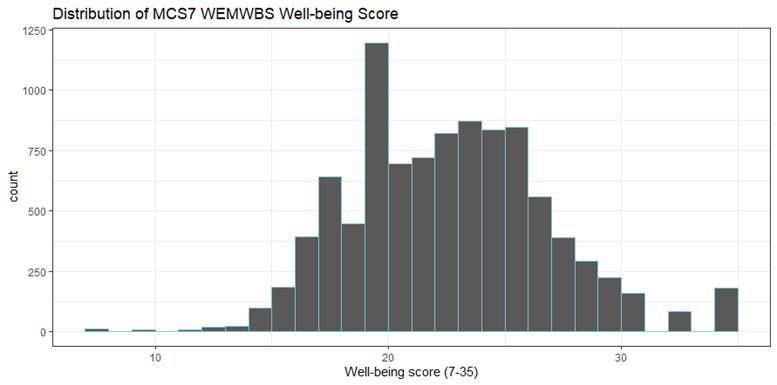
The second dependent variable of interest in this study was general wellbeing, measured by the WEMWBS. WEMWBS version used in MCS7 is a seven-item scale that is widely used to assess mental wellbeing, both at the population level and in targeted evaluations of specific groups (Tennant et al., 2007: 2). Each positively worded item can be evaluated from 1 (lowest) to 5 (highest), thus for the seven-item scale, the total wellbeing score for each participant ranges from 7 to 35. Figure 2 displays the distribution of WEMWBS scores, which closely approximates a normal distribution. The median score of 22.35 is very similar to the mean score of 22.49, indicating a relatively balanced distribution of responses across the scale.
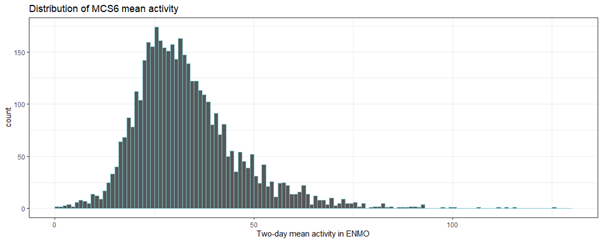
The independent variable of interest was the activity levels during the MCS6 data collection. All cohort members in Scotland, Wales, Northern Ireland, as well as 81 per cent of England respondents, wore wrist accelerometers for two randomly selected 24-hour periods in ten days following the questionnaire visit. While a total of 10,337 cohort members were eligible for activity monitoring during MCS6, only 4159 individuals returned accelerometers with valid data for both days, and an additional 645 individuals provided data for one day (Fitzsimons et al., 2020a: 42). The distribution of mean activity levels over the two days exhibited a bell-shaped curve with a long tail on the right side (Figure 3). This indicates that only a small number of respondents were highly active, while the majority fell within the range of 0 to 75 mg in terms of average activity levels.
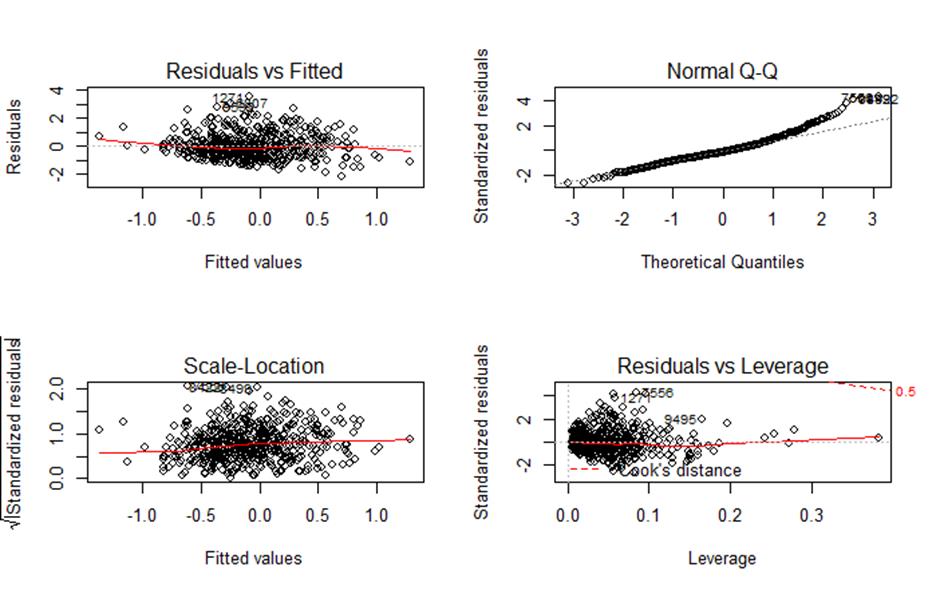
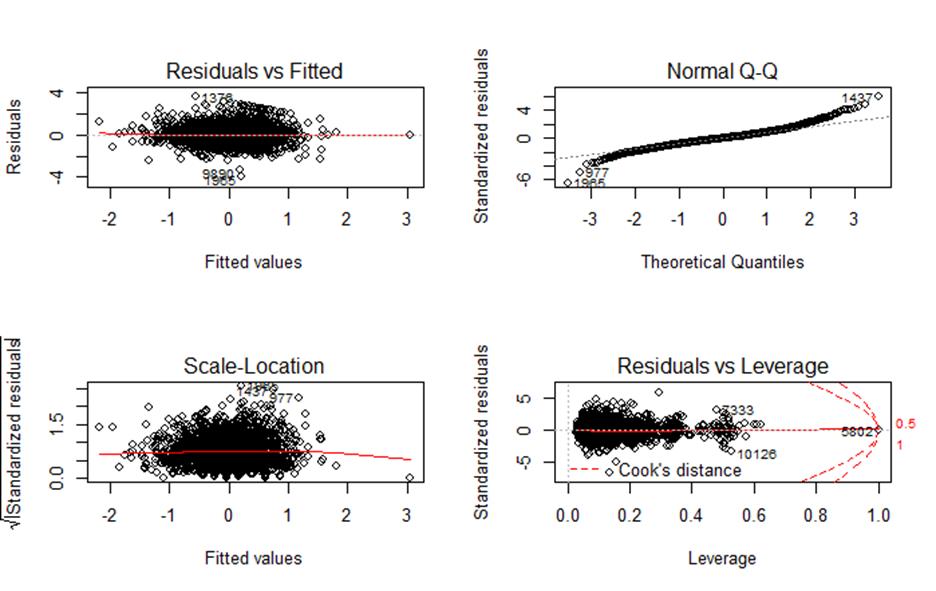
Binary logistic regression was the selected statistical method to examine the relationship between mean activity levels and mental distress, as measured by the Kessler K6 scale while controlling for other confounding variables. This choice was made based on the slight violation of linearity assumptions observed in diagnostic plots, as well as the skewness evident in Figure 1. The residuals plotted against the fitted values and normality of residuals’ distribution deviated from the dashed line; however, the scale-location plot – depicting the distribution of residuals across the predictors – as well as influential cases plot in Figure 4 indicates a good model fit.
To investigate the association between the wellbeing score from MCS7 and mean activity levels, a linear regression analysis with standardised variables was performed. This choice was based on the distribution of the wellbeing score (Figure 2), which is closer to normal, and the absence of any severe violations of linearity, as indicated by Figure 5.
Diagnostic plots were utilised to ensure the validity of interpreting the outcomes within the assumptions of logistic and linear regressions. Prior to the analysis, the datasets containing the variables of interest were merged based on the MCS identification number. All variables were standardised, and any missing data was recoded into ‘NA’ to avoid result distortion. In both models, weights, clustering and stratification data from MCS7 were incorporated to address representativeness and non-response concerns, given that the sample is limited to participants in the final sweep.
Running the base model of the outcome variable (Kessler K6 score) and the single predictor (mean activity) showed that a unit increase in mean activity decreases the odds of mental distress by a factor of 0.77 with a p-value (<0.001), indicating a statistically significant association, shown in Table 2 below.
| Mental distress (K6 score > 13) | |||
| Predictors | Estimates | CI | p |
| (Intercept) | 0.66 | 0 - Inf | 0.68 |
| Mean activity | 0.77 | 0.68 - 0.88 | <0.01 |
| Number of observations | 4020 | ||
| McFadden’s R2/R2 adjusted | 0.77/0.68 |
After incorporating the confounding variables into the model, the mean activity levels lost their statistical significance and showed an even higher likelihood of mental distress, as indicated in Table 3. Due to missing data, only 2543 observations remained for the analysis. However, McFadden’s R2 (a pseudo-R2 conceptually similar to the R2 used in OLS (Smith and McKenna, 2013: 18) showed great predictive power of the model – that is, the model explained around 79 per cent (adjusted) to 88 per cent (unadjusted) of the variation in the Kessler K6 score. Surprisingly, most of the variables, including mean activity levels, did not significantly predict mental distress during adolescence, with a p-value over 0.05.
| Mental distress (K6 score > 13) | |||
| Predictors | Estimates | CI | p |
| (Intercept) | 65.7 | 0 - Inf | 0.99 |
| COHORT MEMBER | |||
| Mean activity | 0.89 | 0.75 - 1.07 | 0.24 |
| Sex | 1.33 | 0.98 - 1.79 | 0.06 |
| Age | 0.95 | 0.80 - 1.12 | 0.52 |
| Wellbeing Score (MCS6) *** | 2.2 | 1.81 - 2.69 | <0.01 |
| Cognitive Score (MCS4) | 1.06 | 0.89 - 1.25 | 0.52 |
| Cognitive Score (MCS6) | 1.07 | 0.89 - 1.28 | 0.47 |
| BMI | 1.04 | 0.73 - 1.47 | 0.84 |
| Body fat | 1.05 | 0.67 - 1.64 | 0.83 |
| Exercise habits (MCS4) * | 1.2 | 1.00 - 1.44 | 0.04 |
| PARENT | |||
| Activity | 1.12 | 0.94 - 1.33 | 0.22 |
| General health (MCS4) | 1.00 | 0.83 - 1.22 | 0.93 |
| General health (MCS7) | 1.18 | 0.98 - 1.41 | 0.07 |
| Reading for child | 0.39 | 1.33 - 1.14 | 0.99 |
| Education | 0.97 | 0.81 - 1.15 | 0.72 |
| Income | 0.96 | 0.82 - 1.12 | 0.59 |
| Continuous employment (MCS4) | 0.92 | 0.75 - 1.12 | 0.42 |
| Continuous employment (MCS6) | 1.14 | 0.94 - 1.38 | 0.17 |
| Number of observations | 2543 | ||
| McFadden’s R2/R2 adjusted | 0.88/0.79 |
Table 4 provides insights into the marginal effects of the predictors, despite only two predictors demonstrating statistical significance (wellbeing score from MCS6 and exercise habits from MCS4). The marginal effect of mean activity indicated that each additional unit (mg) increase resulted in a 0.9 per cent decrease in the likelihood of mental distress in MCS7. However, the marginal effects of the statistically significant variables revealed that a one-unit increase in the wellbeing score from MCS6 increased the likelihood of distress by 7.9 per cent. Additionally, an increase in MCS4 exercise habits, reflecting less exercise (from 1 – exercising five or more days a week, to 7 – not exercising at all), raised the chance of mental distress by 1.8 per cent.
| Predictors | Marginal effect |
| COHORT MEMBER | |
| Mean activity | -0.009 |
| Sex | 0.039 |
| Age | 0.002 |
| Wellbeing Score (MCS6) *** | 0.079 |
| Cognitive Score (MCS4) | 0.003 |
| Cognitive Score (MCS6) | 0.008 |
| BMI | 0.011 |
| Body fat | -0.005 |
| Exercise habits (MCS4) * | 0.018 |
| PARENT | |
| Activity | 0.008 |
| General health (MCS4) | 0.002 |
| General health (MCS7) | 0.023 |
| Reading for child | -0.002 |
| Education | -0.009 |
| Income | -0.003 |
| Continuous employment (MCS4) | 0.000 |
| Continuous employment (MCS6) | 0.005 |
The base model with the outcome as MCS7 wellbeing score and the predictor as mean activity levels showed a small but positive association (0.08, p < 0.01) with the wellbeing score – that is, more activity should lead to better wellbeing outcomes, as seen in Table 5.
| Mental wellbeing (WEMWBS score) | |||
| Predictors | Estimates | Std. error | p |
| (Intercept) | 0.00 | 0.02 | 0.75 |
| Mean activity | 0.08 | 0.02 | <0.01 |
| Number of observations | 4004 | ||
| R2 / R2 adjusted | 0.58% / 0.56% |
When all confounders were included in the model, the impact of mean activity levels diminished and lost statistical significance, as shown in Table 6. Unfortunately, a substantial number of observations were excluded due to missing data, resulting in a final working sample of 2140 data points. However, R2 suggested that the model explained 12 per cent (adjusted) to 26 per cent (unadjusted) of the variation, indicating a significant increase in predictive power as compared to the base linear model without confounders (Table 5).
| Mental wellbeing (WEMWBS score) | |||
| Predictors | Estimates | Std. error | p |
| (Intercept) | -0.03 | 0.46 | 0.95 |
| COHORT MEMBER | |||
| Mean activity | 0.03 | 0.02 | 0.17 |
| Sex** | -0.12 | 0.04 | <0.01 |
| Age | -0.01 | 0.02 | 0.52 |
| Wellbeing Score (MCS6) *** | -0.34 | 0.03 | <0.01 |
| Cognitive Score (MCS4) | 0.01 | 0.02 | 0.67 |
| Cognitive Score (MCS6) | 0.00 | 0.02 | 0.82 |
| BMI | -0.03 | 0.05 | 0.56 |
| Body fat | 0.02 | 0.06 | 0.76 |
| Exercise habits (MCS4) | -0.04 | 0.02 | 0.09 |
| PARENT | |||
| Activity*** | -0.08 | 0.02 | <0.01 |
| General health (MCS4) | 0.00 | 0.02 | 0.74 |
| General health (MCS7)** | -0.07 | 0.02 | <0.01 |
| Reading for child | 0.03 | 0.03 | 0.27 |
| Education | -0.01 | 0.02 | 0.60 |
| Income** | -0.05 | 0.02 | <0.01 |
| Continuous employment (MCS4) | 0.02 | 0.02 | 0.33 |
| Continuous employment (MCS6) | 0.00 | 0.02 | 0.98 |
| Number of observations | 2140 | ||
| R2/R2 adjusted | 0.26/0.12 |
By including the measurement of mental wellbeing from the previous sweep (MCS6), the linear regression model transformed into a lagged outcome model. Removing the wellbeing score from MCS6 resulted in a significant drop in explanatory power, with only 5 per cent of the variation explained (adjusted R2). Thus, controlling for the wellbeing level three years prior was crucial, as it heavily influenced the wellbeing level at MCS7, accounting for 7 per cent of the variation. Unfortunately, a lagged outcome model was not feasible when examining the relationship between mental distress and activity levels as the Kessler K6 scale was introduced in MCS7, while a different scale (SDQ) was used in previous sweeps.
Similar to the logistic regression results, not all explanatory variables demonstrated statistical significance. Although several confounding variables had small individual effects, they collectively contributed to lower wellbeing scores. Interestingly, mean activity levels from MCS6, which were the main focus as an independent variable, showed a positive association but did not yield a significant effect on the mental wellbeing score in MCS7.
In the regression analyses, mean activity levels at age 14 (MCS6) initially showed a significant relationship with mental distress and wellbeing at age 17. However, when confounding variables were added, the significance diminished, indicating the occurrence of Simpson’s paradox (Carlson, 2019). The associations between mean activity levels and mental distress, as well as mental wellbeing in adolescence, were found to be statistically insignificant. These findings suggest that childhood physical activity levels may not be strongly associated with mental health outcomes in adolescence.
Interestingly, the wellbeing score from MCS6 emerged as a significant predictor in both models. Surprisingly, a higher wellbeing score in MCS6 was associated with a higher likelihood of mental distress and lower wellbeing in MCS7. This unexpected result could be due to the timing of data collection during a critical period in the cohort members’ lives or the potential unnecessary adjustment of variables (Schisterman et al., 2009: 493). Overall, the well-adjusted models provided more reliable insights and showed a good fit, indicating that the initial relationships observed in the base models were influenced by confounding factors.
Previous studies examining the relationship between physical activity and mental health outcomes have yielded mixed results. One study using over 6000 MCS participants’ data found that sedentary time at age 7 was associated with peer problems at age 11, as measured by the SDQ (Ahn et al., 2017: 95). However, this study evaluated mental health outcomes at age 17 using the Kessler K6 scale for mental distress and the WEMWBS, and no strong evidence of an association with physical activity was found. The SDQ, with its multiple categories, provided a more detailed analysis of specific aspects of mental health. Another study investigating physical activity levels at ages 12–13 and mental health outcomes at ages 15–16 also used linear regression and included both the SDQ and WEMWBS (Bell et al., 2019: 3). This study did not find strong evidence supporting an association between physical activity and better mental wellbeing or reduced symptoms of mental conditions in adolescents. However, a positive association was observed between physical activity and the emotional problems subscale of the SDQ, indicating that physical activity may potentially reduce symptoms of depression and anxiety in adolescents.
Other studies using different methodologies, such as self-reported questionnaires for physical activity measurement, have also yielded mixed results. Some found that physical activity (or lack of it) influences some, but not all, mental health outcomes (Ashdown-Franks et al., 2017: 22; Suetani et al., 2017: 119), some found no longitudinal association between physical activity and future mental health status (Birkeland et al., 2009: 30; Brunet et al., 2013: 28; Toseeb et al., 2014: 1097), while others reported a positive outcome of structured physical activities on mental health (Jewett et al., 2014: 642).
Overall, these findings suggest that raw physical activity data may be a better predictor of specific mental health outcomes, such as those assessed by the SDQ, but less so of general mental distress or wellbeing. The study’s strengths and limitations are discussed in the following sections, along with recommendations for future research.
A notable strength of the study is the usage of objective physical activity measurement. Accelerometers prevent underestimation or overestimation as compared to self-reported questionnaires; however, they lack the context of movement, which may be an important factor when considering the mental health and physical activity relationship. Types of movement are not equal – structured physical activity, such as team sports, gardening or games including social interactions would be a contextual predictor of mental health outcomes. In addition, participation in structured sports activities leads to a greater development of the cognitive function, as they tend to be interactive, strategic and goal-oriented (Aggio et al., 2016: 1080), and they alleviate depressive symptoms (Brunet et al., 2013: 28; Jewett et al. 2014: 642). To research purposeful, structured activity, accelerometer data may be combined with self-reported questionnaires to distinguish types of activity.
This study uses the newest published data of MCS at the time of writing, incorporating three sweeps in total – MCS4 (age 7), MCS6 (age 14), and MCS7 (age 17) – and having over 10,000 cases in the working sample. One limitation is that the MCS is representative of a particular cohort included in the study, not the whole population. However, even with a substantial sub-sample, data loss affected the scope of the study. Selected explanatory variables with a majority of missing values were excluded from the analysis, as they were driving the working sample down. Still, four-fifths of the observations from the dataset were dropped in regression analyses. Although multiple imputation would help with this issue, there is a threat of distorting the data, even when controlling for weighting, clustering stratification. Perhaps the imputation could be carried out by groups rather than all subjects simultaneously (Bell and Fairclough, 2014: 451) to minimise the impact of distortion.
The age of the cohort members at the time of the study should be taken into consideration too. The Kessler K6 scale is often used with adults, as it entails assessing certain situations, which may be yet unfamiliar for children. The scale was first used in MCS7 with cohort members whose age ranged from 16.1 to 18.3. This life period marks a pivotal transition from childhood to adulthood: the end of compulsory education, moving away from home, and end of Child and Adolescent Mental Health Services (CAMHS) – these factors can contribute to widening economic, social, and health inequalities (Patalay and Fitzsimons, 2021: 3). In addition, individual and sex developmental pattern differs (Miller et al., 1995: 29), therefore, using the Kessler K6 scale already puts many of the adolescents in adults’ shoes.
This study aimed to investigate the relationship between physical activity, mental distress and wellbeing. Objective physical activity data from accelerometers were used, along with well-established measures of mental distress (Kessler K6 scale) and mental wellbeing (WEMWBS). The findings suggest that while raw physical activity data from accelerometers may be a better predictor of specific mental health outcomes, such as those assessed by the SDQ, it may have less predictive power for general mental distress or wellbeing.
With the COVID-19 pandemic driving remote data collection (Savage et al., 2020) and the increasing use of health technology in precision and preventive medicine (Phillips et al., 2019), there is growing interest in the use of accelerometers for measuring and evaluating the health impacts of physical activity. Accelerometers have the potential for both prevention and behaviour change interventions. Therefore, it is recommended to further explore their use for activity measurement. However, it is important to combine accelerometer data with self-reported questionnaires in future studies. This combination would help distinguish between raw movement and purposeful, structured physical activity, such as team sports, which may have additional cognitive, emotional and social benefits.
In addition, numerous studies have already demonstrated the benefits of physical activity on mental and physical health across different age groups and genders. Physical activity is actively promoted in schools and workplaces to enhance wellbeing and prevent weight-related health conditions. One interesting finding in this study was that lower exercise levels at age 7 were associated with an increased likelihood of mental distress at age 17, highlighting the potential impact of exercise habits established in early childhood on health outcomes in adolescence.
Figure 1: Kessler K6 score distribution from MCS7 sweep.
Figure 2: WEMWBS score distribution from MCS7 sweep.
Figure 3: Two-day mean activity distribution from MCS6.
Figure 4: Diagnostic plots testing linear regression assumptions for mental distress association.
Figure 5: Diagnostic plots testing linear regression assumptions for wellbeing score association.
[All graphs are produced by the author]
Table 1: Confounding variables with an indication of measurement.
Table 2: Logistic regression (no confounders) results in odds ratio estimates.
Table 3: Logistic regression results in odds ratio estimates.
Table 4: Marginal effects of explanatory variables.
Table 5: Linear regression (no confounders) results in standardised estimates.
Table 6: Linear regression results in standardised estimates.
Aggio D., L. Smith, A. Fisher and M. Hamer (2016), ‘Context-specific associations of physical activity and sedentary behavior with cognition in children’, Am J Epidemiol, 183, 1075–82.
Ahn, J. V., F. Sera, S. Cummins and E. Flouri (2017), ‘Associations between objectively measured physical activity and later mental health outcomes in children: findings from the UK Millennium Cohort Study’, Child and Adolescent Health, 72, 94–100.
Althubaiti, A. (2016), ‘Information bias in health research: definition, pitfalls, and adjustment methods’, Journal of Multidisciplinary Healthcare, 9, 211–17.
Ashdown-Franks, G., C. Sabiston, S. Solomon-Krakus and J. O’Loughlin (2017), ‘Sports participation in high school and anxiety symptoms in young adulthood’, Ment. Health Phys. Activity, 12, 19–24.
Bell, S. L., S. Audrey, D. Gunnell, A. Cooper and R. Campbell (2019), ‘The relationship between physical activity, mental wellbeing, and symptoms of mental health disorder in adolescents: a cohort study’, Int J of Behavioural Nutr and Phys Act, 16 (1), 138.
Bell, M. L. and D. L. Fairclough (2014), ‘Practical and statistical issues in missing data for longitudinal patient reported outcomes’, Statistical Methods in Medical Research, 23, 440–59.
Birkeland, M., T. Torsheim and B. Wold (2009), ‘A longitudinal study of the relationship between leisure-time physical activity and depressed mood among young adolescents’, Psychol. Sport Exerc, 10 (1), 25–34.
Brunet, J., C. M. Sabiston, M. Chaiton, T. A. Barnett, E. O’Loughlin, N. C. P. Low and J. L. O’Loughlin (2013), ‘The association between past and current physical activity and depressive symptoms in young adults: a 10-year prospective study’, Ann. Epidemiol., 23 (1), 25–30.
Carlson, B. W. (2019), ‘Simpson’s paradox’, Encyclopedia Britannica, available at https://www.britannica.com/topic/Simpsons-paradox.
Centre for Longitudinal Studies (CLS) (2020), ‘Millennium cohort study user guide (Surveys 1–5)’, London: UCL Centre for Longitudinal Studies.
Fitzsimons, E., Haselden, L., Smith, K., Gilbert, E., Calderwood, L., Agalioti-Sgompou and J. Johnson (2020a), ‘Millennium cohort study sixth survey 2015–16 user guide’, London: UCL Centre for Longitudinal Studies.
Fitzsimons, E., Haselden, L., Smith, K., Gilbert, E., Calderwood, L., Agalioti-Sgompou, S., Veeravalli, R., Silverwood and G. Ploubidis (2020b), ‘Millennium cohort study age 17 sweep (MCS7): user guide’, London: UCL Centre for Longitudinal Studies.
Hoegh Poulsen, P., Biering and J. Andersen (2016), ‘The association between leisure time physical activity in adolescence and poor mental health in early adulthood: a prospective cohort study’, BMC Public Health, 16 (3), available at https://www.ncbi.nlm.nih.gov/pmc/articles/PMC4700625/, accessed on 12 October 2023.
Janssen, I. and A. G. LeBlanc (2010), ‘Systematic review of the health benefits of physical activity and fitness in school-aged children and youth’, International Journal of Behavioral Nutrition and Physical Activity, 7 (40), available at https://rdcu.be/dopVo, accessed 12 October 2023.
Jerstad, S., K. Boutelle, K. Ness and E. Stice (2010), ‘Prospective reciprocal relations between physical activity and depression in female adolescents’, J. Consult Clin., 78 (2), 268–72.
Jewett, R., C. M. Sabiston, J. Brunet, E. K. O’Loughlin, T. Scarapicchia and J. O’Loughlin (2014), ‘School sport participation during adolescence and mental health in early adulthood’, J. Adolesc. Health, 55 (5), 640–44.
Kessler, R. C., J. G. Green, M. J. Gruber, N. A. Sampson, E. Bromet, M. Cuitan, T. A. Furukawa, O. Gureje, H. Hinkov, C. Y. Hu, C. Lara, S. Lee, Z. Mneimneh, L. Myer, M. Oakley-Browne, J. Posada-Villa, R. Sagar, M. C. Viana and A. M. Zaslavsky (2010), ‘Screening for serious mental illness in the general population with the K6 screening scale: Results from the WHO World Mental Health (WMH) survey initiative’, International Journal of Methods in Psychiatric Research, Suppl 1(Suppl 1), 4–22.
Miller, N. B., L. K. Silverman and F. R. Falk (1995), ‘Emotional development, intellectual ability, and gender’, J for the Education of the Gifted, 18 (1), 20–38.
NHS Digital (2021), ‘Mental health of children and young people in England 2021’, available at https://digital.nhs.uk/data-and-information/publications/statistical/mental-health-of-children-and-young-people-in-england/2021-follow-up-to-the-2017-survey, accessed 6 June 2023.
Ohrnberger, J., E. Fichera and M. Sutton (2017), ‘The relationship between physical and mental health: A mediation analysis’, Soc Sci & Medicine, 195, 42–49.
Patalay, P. and E. Fitzsimons (2021), ‘Psychological distress, self-harm and attempted suicide in UK 17-year olds: Prevalence and sociodemographic inequalities’, Br J Psychiatry, 219(2), 437–39.
Phillips, S. A., M. Ali, C. Modrich, S. Oke, A. Elokda, D. Laddu and S. Bond (2019), ‘Advances in health technology use and implementation in the era of healthy living: Implications for precision medicine’, Progress in Cardiovascular Diseases, 62, 44–49.
Reilly, J. J., V. Penpraze, J. Hislop, G. Davies, S. Grant and J. Y. Paton (2008), ‘Objective measurement of physical activity and sedentary behaviour: Review with new data’, Archives of Disease in Childhood, 93 (7), 614–19.
Savage, M. J., R. James, D. Magistro, J. Donaldson, L. C. Healy, M. Nevill and P. J. Hennis (2020), ‘Mental health and movement behaviour during the COVID-19 pandemic in UK university students: Prospective cohort study’, Mental Health and Physical Activity, 19, available at https://www.sciencedirect.com/science/article/pii/S1755296620300417, accessed on 12 October 2023.
Schuch, F., D. Vancampfort, J. Firth, S. Rosenbaum, P. Ward, T. Reichert, N. C. Bagatini, R. Bgeginski and B. Stubbs (2016), ‘Physical activity and sedentary behavior in people with major depressive disorder: A systematic review and meta-analysis’, J. Affect Disord, 210, 139–50.
Schisterman, E., S. Cole and R. Platt (2009), ‘Overadjustment bias and unnecessary adjustment in epidemiologic studies’, Epidemiology, 20, 488–95.
Smith, T. J. and C. M. McKenna (2013), ‘A Comparison of logistic regression pseudo R2 indices’, Multiple Linear Regression Viewpoints, 39 (2), 17–26.
Ströhle, A., M. Höfler, H. Pfister, A. G. Müller, J. Hoyer, H. U. Wittchen and R. Lieb (2007), ‘Physical activity and prevalence and incidence of mental disorders in adolescents and young adults’, Psychol. Med., 37 (11), 1657–66.
Stubbs, B., J. Firth, A. Berry, F. B. Schuch, S. Rosenbaum, F. Gaughran, N. Veronesse, J. Williams, T. Craig, A. R. Yung and D. Vancampfort (2016), ‘How much physical activity do people with schizophrenia engage in? A systematic review, comparative meta-analysis and meta-regression’, Schizophr. Res., 176, 431–40.
Suetani, S., A. Mamun, G. M. Williams, J. M. Najman, J. J. McGrath and J. G. Scott (2017), ‘Longitudinal association between physical activity engagement during adolescence and mental health outcomes in young adults: A 21-year birth cohort study’, J of Psych. Research, 94, 116–23.
Tennant, R., L. Hiller, R. Fishwick, S. Platt, S. Joseph, S. Weich, J. Parkinson, J. Secker and S. Stewart-Brown (2007), ‘The Warwick–Edinburgh Mental Wellbeing Scale (WEMWBS): Development and UK validation’, Health and Quality of Life Outcomes, 5 (63), available at https://rdcu.be/dopVR, accessed 12 October 2023.
Toseeb, U., S. Brage, K. Corder, V. J. Dunn, P. B. Jones, M. Owens, M. C. St Clair, E. M. van Sluijs and I. M. Goodyer (2014), ‘Exercise and depressive symptoms in adolescents: a longitudinal cohort study’, JAMA Pediatr., 168 (12), 1093–100.
Yang CC and Hsu YL. (2010), ‘A review of accelerometry-based wearable motion detectors for physical activity monitoring’, Sensors (Basel), 10 (8), 7772-88.
Glossary of terms
Accelerometer: A device used to measure and record acceleration, typically used in research to assess physical activity levels by tracking bodily movements.
Cambridge Gambling Task: A cognitive task used in research to study decision-making and risk-taking behaviour, often employed in studies related to addiction and gambling.
Centre for Longitudinal Studies (CLS): A leading research centre in the United Kingdom specialising in longitudinal studies and large-scale datasets, such as the Millennium Cohort Study.
Epidemiological Research: A field of research that focuses on the distribution, causes and patterns of health-related conditions and diseases in populations, aiming to improve public health.
Euclidean Norm Minus One (ENMO): A mathematical metric used in physical activity research to quantify the intensity of movement by measuring deviations from normal body acceleration.
Hawthorne Effect: A psychological phenomenon where individuals modify their behaviour when they are aware of being observed, potentially leading to biased research results.
Kessler K6 Scale: A self-report assessment tool for measuring psychological distress and identifying symptoms of anxiety and depression in research and clinical contexts.
Leicester Height Measure: a standardised tool for accurately measuring height in research, particularly in studies involving children or anthropometric assessments.
Longitudinal Research: A research design that involves the repeated observation or measurement of the same individuals or groups over an extended period to track changes and trends over time.
Millennium Cohort Study: A long-term, large-scale research project in the United Kingdom conducted by the Centre for Longitudinal Studies that tracks the development and wellbeing of children born at the turn of the twenty-first century.
Rosenberg Self-Esteem Scale: A widely used questionnaire designed to measure self-esteem and self-worth in research on psychology and self-perception.
Simpson’s Paradox: A statistical phenomenon where trends or associations observed in separate groups or sub-populations can be reversed or distorted when the data from those groups are combined, highlighting the importance of subgroup analysis in research.
Strengths and Difficulties Questionnaire (SDQ): A widely used screening tool in child and adolescent mental health research that assesses emotional and behavioural issues in children and adolescents.
Tanita Scales: A brand of digital scales commonly used in research and clinical settings to measure body weight, body composition and other health-related metrics.
Warwick–Edinburgh Mental Wellbeing Scale (WEMWBS): A self-reported questionnaire used to measure mental wellbeing and psychological flourishing in research settings.
Word Activity: A measurement or task in cognitive psychology and neuroscience research, assessing language processing and cognitive abilities through word-based exercises.
To cite this paper please use the following details: Karvelyte, I. (2023), 'Are Physical Activity Levels in Childhood Associated with Future Mental Health Outcomes? Longitudinal Analysis Using Millennium Cohort Study Data', Reinvention: an International Journal of Undergraduate Research, Volume 16, Issue 2, https://reinventionjournal.org/article/view/967. Date accessed [insert date]. If you cite this article or use it in any teaching or other related activities please let us know by e-mailing us at Reinventionjournal@warwick.ac.uk.