Naomi Law, University of St Andrews
Previous research has demonstrated that individuals with anorexia nervosa display elevated autistic traits in comparison to individuals who do not have the disorder. However, it remains unknown as to whether this relationship is a stable trait of individuals or if it is caused by a psychological or physical state. This study investigated the state vs trait nature of the relationship between disordered eating and autistic traits in a non-clinical sample, while additionally exploring the ability of cognitive inflexibility to predict this relationship. Thirty-four undergraduate students from the University of St Andrews completed questionnaires regarding their affect, disordered-eating attitudes and autistic traits alongside a measure of set-shifting ability in the Brixton Spatial Anticipation test during a period of examination stress and a period of no stress. It was revealed that on both occasions, individuals who scored higher on a test of disordered-eating attitudes also scored higher on a test measuring autistic traits. This relationship was stronger when participants were stressed. Autistic traits were also found to significantly predict a change in eating attitudes between a stress-induced state and pre-existing trait conditions. Inflexibility, as reflected by Brixton scores, did not appear to relate to either measure. These results indicate that slightly elevated autistic traits in those exhibiting disordered-eating attitudes may be state-dependent, as opposed to reflecting the engrained traits of the individual. Findings are discussed in relation to future research replicating the study with a larger sample and implications for the diagnosis and treatment of anorexia.
Keywords: Eating disorders in non-clinical populations, anorexia and autism, state vs trait nature of eating disorders, cognitive inflexibility in eating disorders.
Anorexia nervosa (AN) is a mental illness characterised by a persistent fear of weight gain, disturbance in body image and continuous restriction of energy intake. Autism spectrum disorder (ASD) is a neurodevelopmental disorder, diagnosed by difficulties regarding social communication, restricted interests and repetitive behaviour (American Psychiatric Association, 2013). In recent years, an influential line of research exploring the cognitive similarities and clinical relationship between AN and ASD has emerged. The first case study in this area was published in 1988, depicting a female with infantile autism who developed AN upon entering puberty (Rothery and Garden, 1988). Since then, Huke, Turk, Saeidi, Kent and Morgan (2013) have estimated the prevalence of ASD in disordered-eating populations at 23 per cent, with Gillberg and Råstam (1992) also stating that 23 per cent of girls with AN exhibit an outward manifestation of autistic behaviour, such as ‘social problems and communication peculiarities’. Such evidence has led to the exploration of shared endophenotypes between the two disorders (Zucker et al., 2007), the identification of atypical eating behaviours in ASD (Karlsson, Råstam and Wentz, 2013) and even the suggestion that AN may be a female presentation of ASD (Treasure, 2013). However, the notion that AN and ASD may result from the same underlying endophenotype is constrained due to the matter that ASD is a pervasive, lifelong disorder, whereas AN is a mental illness that can be recovered from. Currently, deciphering whether the pathophysiological similarities between AN and ASD are state-dependent or trait-dependent has been overlooked in literature, but may have implications regarding diagnostic process, prevention and treatment.
The proposed relationship between AN and ASD was formed on the basis of clinical observations, particularly food refusal and selective eating in those with ASD (Gillberg, 1983; Råstam, 2008). Such observations sparked further investigation into the cognitive deficits of AN populations, as even fully recovered, weight-restored individuals tended towards test profiles similar to those with ASD (Gillberg, Gillberg, Råstam and Johansson, 1996). ‘Weak central coherence theory’ – initially proposed by Frith (1989) and referring to failure to integrate local details into a global entity – is a highly credited explanation for the global difficulties (especially restricted interests) observed in ASD. It has also been empirically noted as associated with AN (Coombs et al., 2011) through use of tasks such as the Rey-Osterrieth Complex Figure Test (Osterrieth, 1944), whereby participants are required to locate hidden shapes. Those with AN and ASD both demonstrate superior detail focus of this task, indicated by faster reaction times relative to healthy controls (Lang et al., 2015).
As such, empirical research has focused largely on the cognitive processing styles that are common across the two disorders, such as those described above. However, one area of difference that has been overlooked thus far is set-shifting – the ability to shift from one course of action to another with little difficulty (Huke, Turk, Saeidi, Kent and Morgan, 2013). Switching ‘back and forth between multiple tasks, operations, or mental sets’ (Miyake et al., 2000) is a major component of executive functioning and is essential for the adaptation of behaviour in line with changing demands of the environment. Individuals with AN are often described as persistent, with rigid or obsessional personalities, representing an outward manifestation of a set-shifting difficulty (American Psychiatric Association, 2013). This is reflected further by low scores from samples of those with AN on the Wisconsin Card Sorting Task (WCST), whereby individuals must match cards based on an unknown rule (Roberts, Tchanturia, Stahl, Southgate and Treasure, 2007).
Dysfunctional set-shifting is also a hallmark of ASD (Yerys et al., 2009). A more general inability to shift attention during daily activities exists in autistic samples (Gioia, Isquith, Kenworthy and Barton, 2002), yet individuals also respond with less accuracy and at a slower rate than healthy controls on the WCST (Dichter et al., 2009). While set-shifting has never been directly compared in AN and ASD samples, Oldershaw, Treasure, Hambrook, Tchanturia and Schmidt (2011) statistically compared the neuropsychological profiles of currently ill patients with anorexia with published scores of individuals with ASD on the WCST and ascertained the two groups to be statistically similar.
Despite Theory of Mind (ToM) difficulties becoming less atypical when AN groups are recovered and weight restored (Oldershaw, Hambrook, Tchanturia, Treasure and Schmidt, 2010), difficulties in set-shifting have been found to persist following recovery (Tchanturia et al., 2004), suggesting they are a durable trait of those with the disorder. For example, Tchanturia et al. (2004) not only found no improvement on a battery of set-shifting tasks following weight recovery, but also hypothesised that poor performance on tests of set-shifting is associated with childhood rigidity – implying that this difficulty exists pre-morbidly to the onset of AN. Similarly, Holliday, Tchanturia, Landau, Collier and Treasure (2005) suggest that poor performance on set-shifting tasks has been observed in the unaffected sisters of individuals with AN, indicating a genetic linkage. Findings from genetic and longitudinal studies such as these imply that cognitive inflexibility persists following weight restoration, and thus may constitute a familial trait that is associated with an increased risk of developing AN.
Data regarding whether general autistic traits persist in individuals with anorexia following recovery is contradictory and inconclusive. The question of whether the relationship between AN and ASD is caused by the permanent traits of the individual or a fleeting state (Chaplin, John and Goldberg, 1988) has been highly debated, with many suggesting that individuals with AN may come to resemble those with ASD due to the chronic starvation or psychological stress associated with the disorder (Hiller and Pellicano, 2013; Treasure, 2013).
This study will aim to accurately isolate whether the relationship between AN and ASD is dependent on the state the individual is in or if it is a durable trait of the individual by utilising a naturally occurring state of stress. Despite the pervasive nature of ASD, individuals with the disorder often experience a worsening or lessening of symptoms under conditions of stress (Baron et al., 2006). Groden et al. (2001) hypothesised that persons with autism may be even more vulnerable to the psychological effects of stress than the general population as they lack the repertoire of appropriate coping mechanisms that others possess. For example, difficulties in communication and social skills, alongside heightened perceptual sensitivity, have been found to lead to an increased vulnerability to stress and elicit an even greater stress response than average (Groden, Prince, Cautela and Berryman, 1994).
Studies have also revealed that stress and eating-disorder symptomatology are positively correlated (Shatford and Evans, 1986; Wolf and Crowther, 1983), even going as far as to suggest that disordered eating in itself may be a manifestation of maladaptive coping styles in response to stress in student populations (Mayhew and Edelmann, 1989). For example, Macht, Haupt and Ellring (2005) found that emotional regulation through eating is experienced in student populations during stressful periods, causing an increased tendency to over-eat or under-eat. These studies suggest that utilising a naturally occurring condition to heighten stress will elicit a pseudo-anxious state that will allow us to measure how autistic traits and disordered-eating attitudes change in response to stress. This study will elicit enduring features of stress in a student sample by testing during the examination period.
This line of research has the potential to make an important contribution towards the clinical field and could potentially influence how AN is diagnosed and treated (Baron-Cohen et al., 2013). However, it also holds extensive implications regarding how the association between disordered eating and autistic traits occurs in non-clinical populations. The notion of the autistic spectrum, in lieu of a single defined disorder, has been extended from clinical samples to the general population, with it now being recognised that there are individual differences in ‘autistic traits’ (Constantino and Todd, 2003). Similarly, dieting and weight-related concerns are extremely prevalent in the general population without an individual meeting the diagnostic criteria for AN, with such behaviours tentatively considered to be risk factors for the subsequent development of eating disorders (Jacobi, Hayward, de Zwann, Kramer and Agras, 2004).
The primary aim of the current study was to identify whether the relationship between disordered-eating attitudes and ASD symptomatology is state- or trait-dependent in a non-clinical sample. In keeping with previous literature that states that those who scored high on tests of disordered-eating attitudes also scored higher on tests of autistic traits (Baron-Cohen et al., 2013), we hypothesised that there would be a relationship between scores on measures of the two constructs in our sample of students. As research also states that symptoms from both spectrums of disorders are heightened during a state of stress, we predicted that scores on both measures would be higher during the examination period when participants were stressed.
A secondary aim of the study was to explore how cognitive inflexibility – an area in which research is mixed – was associated with disordered-eating attitudes and autistic traits. This could reveal the role of set-shifting as a causal and maintenance factor in both disorders. It was predicted that cognitive inflexibility would also be elevated by stress, predicting more errors on a visuospatial test of cognitive flexibility during examinations.
Thirty-four first and second year undergraduate students from the University of St. Andrews volunteered to participate in this experiment using a PsychSONA online registration system. Of this cohort, 9 males and 25 females participated, with ages ranging between 18 and 21 (M=19.88; SD=2.24). Participants were similar in terms of age and education level; however, they were from a range of ethnicities and cultures. All participants were required to have been taking December examinations at an undergraduate level in order to participate. The same sample participated at both Time 1 (in December during the exam period) and Time 2 of the study (in January when exams had ceased).
The 23-item EDI-2 (Garner, 1991; α= 0.95) self-report questionnaire is a widely used measure of attitudes associated with body image and eating-related issues (see Appendix A). The items are divided into three individual sub-scales, including ‘Drive for Thinness’ (α= 0.63) depicting behaviour and feelings related to weight loss, ‘Bulimia’ (α= 0.87) depicting behaviour and attitudes consistent with Bulimia Nervosa (seven items) and ‘Body Dissatisfaction’ (α= 0.88) depicting thoughts and feelings regarding one’s own body (nine items). Participants are asked to rate each item on a 6-point Likert scale in accordance with how applicable the statement is to their general eating attitudes, ranging from ‘always’ (scoring 3 points) to ‘never’ (scoring 0 points). Higher scores indicate greater psychopathology and increased negativity in relation to eating attitudes and behaviours. This test was chosen due to its reliability for measuring eating psychopathology in non-clinical samples (Schoemaker, van Strien and van der Staak, 2010; Tachikawa et al., 2004).
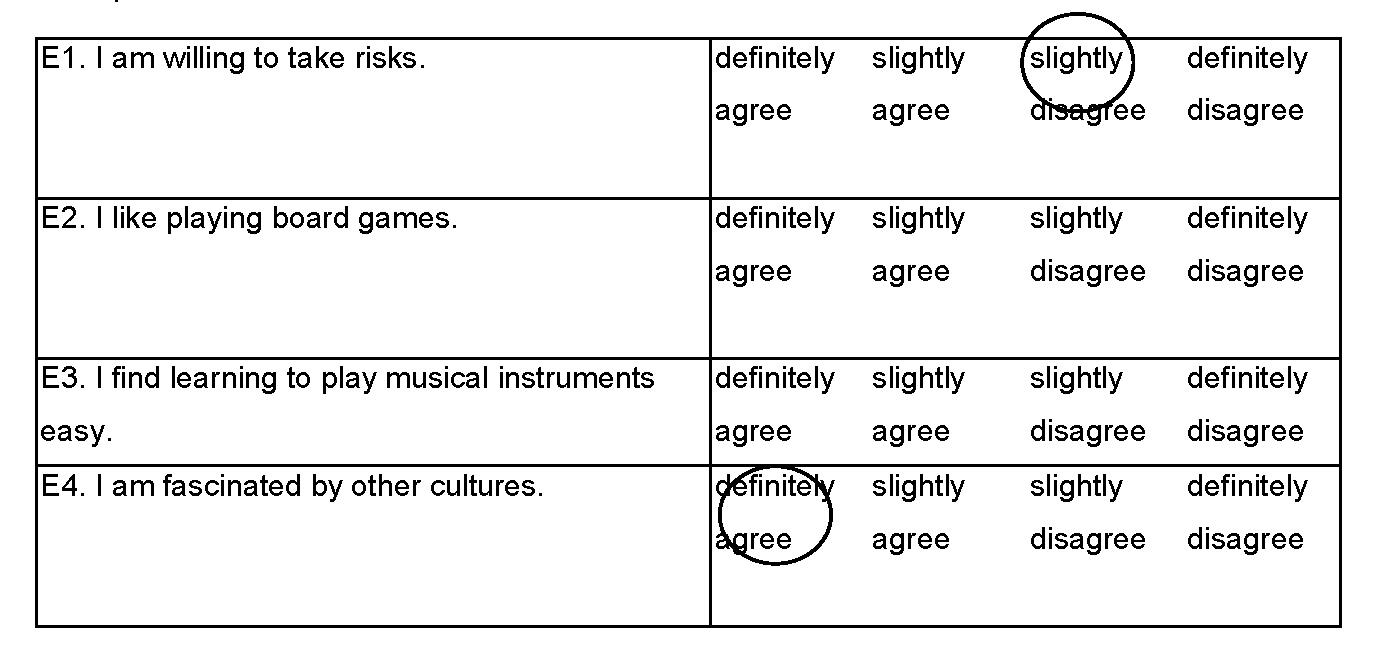
The Autism Spectrum Quotient (AQ) was originally developed as a screening instrument for non-clinical populations to assess how individuals of normal intelligence vary on autistic traits (Stewart and Austin, 2009; see Appendix D). The scale has high test–retest reliability and sound internal reliability with Cronbach’s α for all sub-scales rating between .80 and .84. It is a self-report questionnaire containing 50 items relating to social skills, attention switching, attention to detail and communication. The questionnaire uses a forced-choice format, with each item having four possible responses (‘definitely agree’, ‘slightly agree’, ‘slightly disagree’, ‘definitely disagree’). Respondents are instructed to select one response per item. A point is assigned for each response characteristic of ASD, giving a resulting overall score between 0 to 50. Higher scores indicate more autistic traits. The AQ has scored high for inter-reliability and test–retest reliability in a student sample (Baron-Cohen et al., 2001).
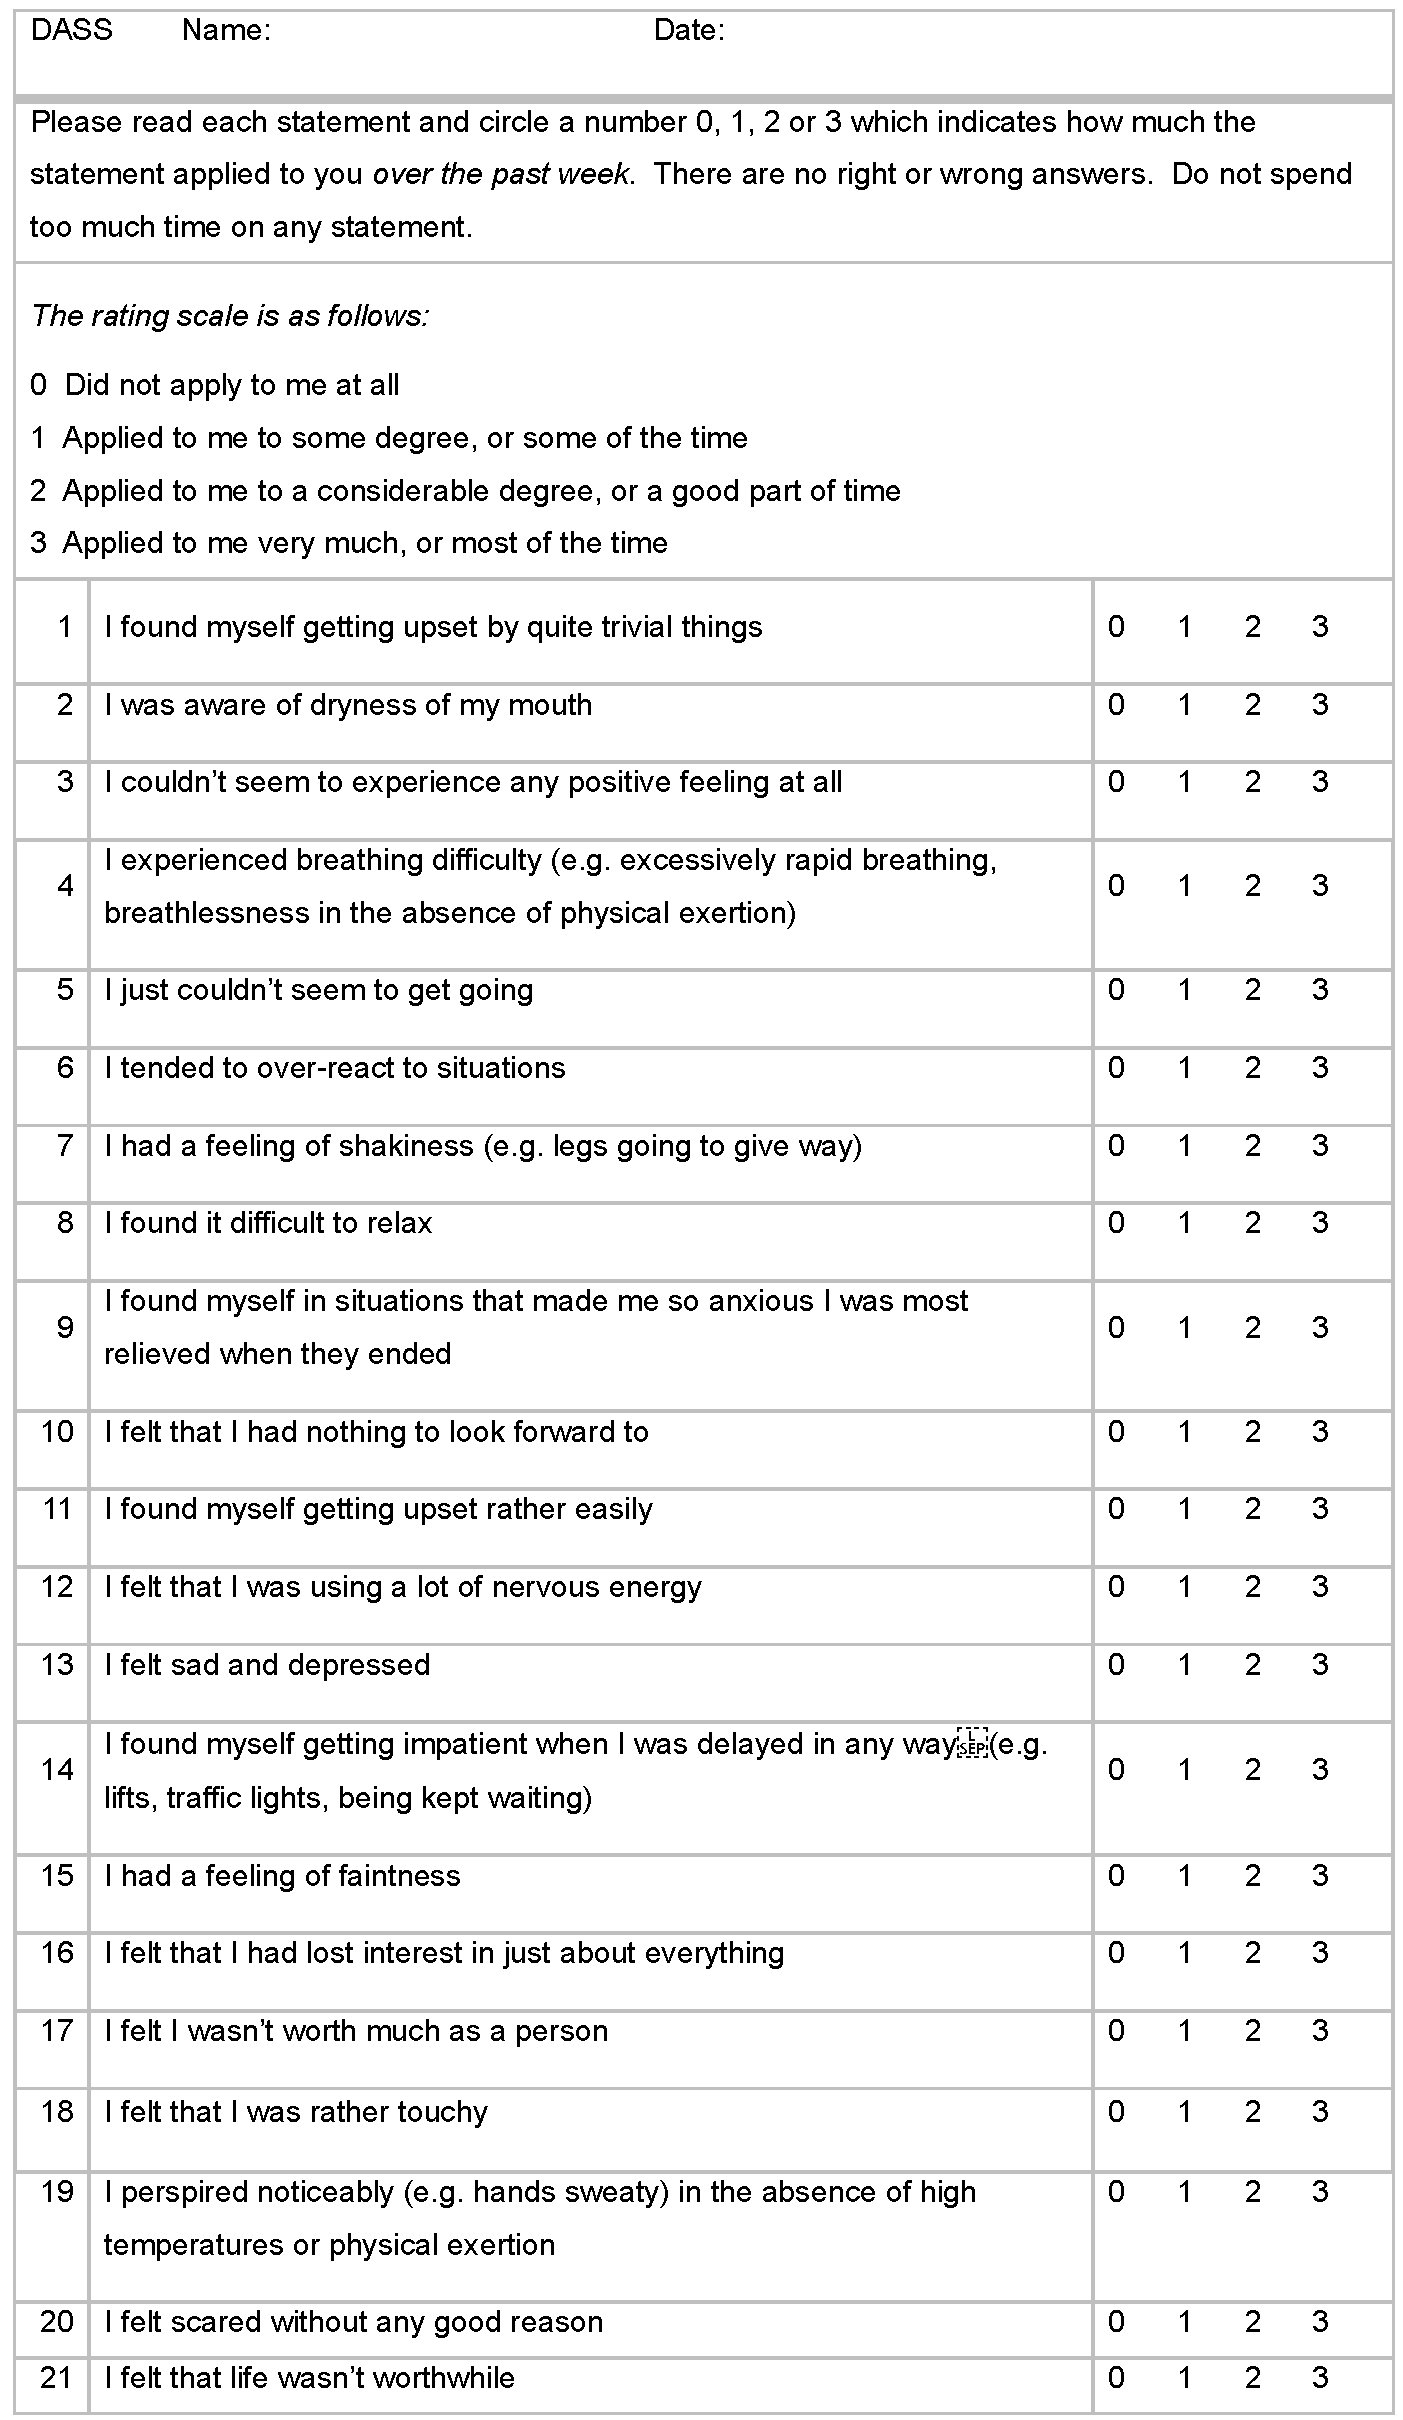
The Depression Anxiety Stress Scales 21 is a shortened form of Lovibond and Lovibond’s (1995) 42-item instrument. It is a 21-item (α= 0.91) self-report test measuring three related negative-affect conditions over the previous week (see Appendix B). It is divided into three sub-scales, each containing seven items designed to assess the psychological features of depression (D-sub-scale; α= 0.94), anxiety (A-sub-scale; α= 0.87) and stress (S-Sub-scale; α= 0.91).
Each statement is rated on a 4-point Likert scale regarding applicability to their mood, from ‘not at all’ (0 points) to ‘always’ (3 points). The higher an individual scores, the greater their negative affect has been over the previous week. It is a reliable measure of state stress, with all scales being recorded as correlating moderately to highly with pre-existing measures of DASS (Antony et al., 1998).
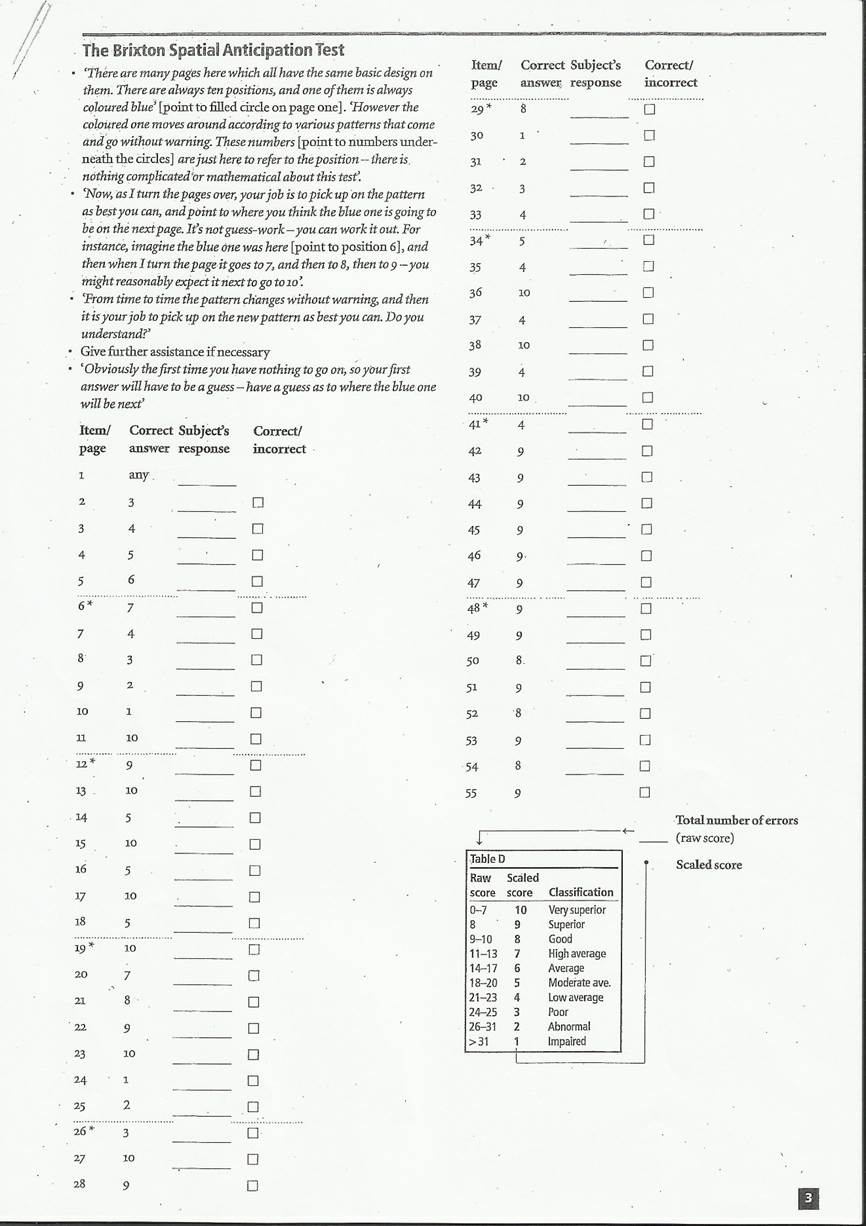
The Brixton is a visuospatial sequencing task that assesses rule-shifting abilities (Burgess and Shallice, 1997; See Appendix C). Participants are presented with a 5 × 2 grid of circles, with one circle filled in blue. They are asked to predict where the blue dot will appear in the next grid. In order to successfully complete the task, the participants must abstract the currently active rule (Craik and Levine, 2012). The pattern by which the blue circle moves changes nine times. Responses for all 56 trials a (56 patterns whereby the rule changes 9 times) are recorded. Total number of errors across the trials is converted into a scaled score, which is then used as an indication of set-shifting ability. Therefore, the lower the number of errors, the greater the set-shifting ability (Lounes, Khan and Tchanturia, 2011).
Participants volunteered their own appointment time between 9 a.m. and 5 p.m. via PsychSONA, with each participant undergoing testing individually in an interview at the University of St. Andrews School of Psychology. After being made aware of the nature of the experiment, subjects signed an informed consent form. They were first requested to complete the three self-report questionnaires independently – namely, the DASS-21, EDI-2 and the AQ. This took approximately 15 minutes, and the questionnaire order was randomised to minimise potential order effects. The participants then completed the Brixton task. This test took approximately 10 minutes, and the experimenter recorded the responses of the participants by pen and scoresheet. The Brixton was always completed last so as to act as a distraction task and reduce any of the potentially harmful effects that may have been caused by being confronted with potentially difficult issues in the three screening self-report questionnaires. All participants were then debriefed on the purpose of the study. Scores on all measures were calculated and statistical analyses were run. This experiment was run twice: Time 1 (T1) was in November, then it was repeated at Time 2 (T2) in January using an identical procedure.
Firstly, as a Shapiro–Wilk test revealed that assumptions of normality were not met, a series of Wilcoxon signed-rank tests were conducted to analyse if the mean scores observed in Table 1 on all measures were significantly different between T1 when participants were stressed and T2 when they were not. It was found that scores on all measures were significantly higher at T1 than T2 at an alpha level of .05, indicating that there was a decrease in scores when participants were not stressed.
| Mean T1 (SD) | Mean T2 (SD) | P-value | |
| AQ | 20.6 (8.39) | 18.5 (7.46) | .015* |
| EDI | 17.1 (16.1) | 12.0 (15.4) | .002** |
| EDI: Body Dissatisfaction | 8.52 (7.72) | 6.15 (6.91) | .024* |
| EDI: Bulimia | 3.64 (4.15) | 2.21 (3.71) | < .001** |
| EDI: Desire for Thinness | 4.82 (5.86) | 3.67 (6.08) | .026* |
| DASS | 44.5 (29.85) | 22.6 (23.74) | < .001** |
| Brixton | 24.8 (4.47) | 21.3 (4.29) | < .001** |
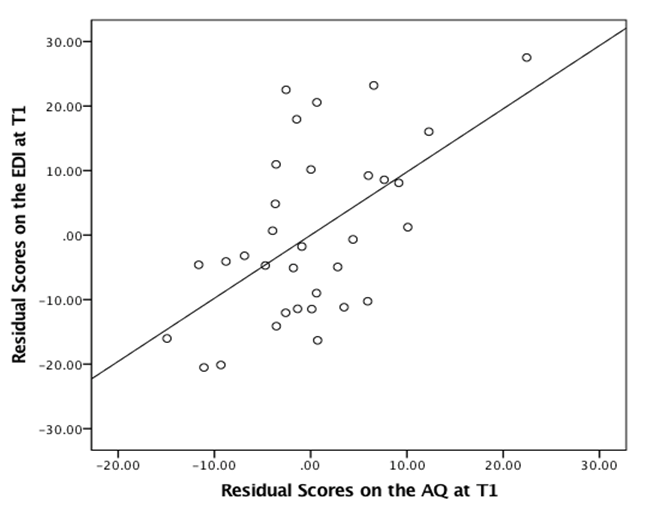
Based on the original hypotheses of this study, we used a Spearman’s rho to identify the relationship between scores on the AQ and EDI at T1 and T2. As shown in Table 2, scores on the AQ and EDI were positively correlated at both T1, (rs= .594) and T2 (rs= .412). While the correlation was considerably stronger at T1 than T2, using the Fisher r-to-z transformation, it was found not to be statistically significant (Z= .95, p= .342). Secondly, no correlation was found between the AQ and the Brixton at either T1 (r s=. 115) or T2 (rs= .023), nor the EDI and the Brixton at T1 (rs=- .019) or T2 (rs= .063).
| Measure | AQ T1 | AQ T2 | EDI T1 | EDI T2 | BRIXTON T1 | BRIXTON T2 | DASS T1 | DASS T2 | |||||||||
| AQ T1 | .896** | .594** | .408* | 0.115 | 0.123 | .458** | 0.335 | ||||||||||
| AQ T2 | .896** | .504** | .412* | -0.014 | 0.023 | 0.335 | .355* | ||||||||||
| EDI T1 | .594** | .504** | .681** | -0.019 | 0.068 | .553** | 0.283 | ||||||||||
| EDI T2 | .408* | .412* | .681** | -0.009 | 0.063 | 0.267 | .502** | ||||||||||
| BRIXTON T1 | 0.115 | -0.014 | -0.019 | 0.009 | .497** | 0.123 | 0.344 | ||||||||||
| BRIXTON T2 | 0.123 | 0.023 | 0.068 | 0.063 | .497** | 0.258 | .352* | ||||||||||
| DASS T1 | .458** | 0.335 | .553** | 0.267 | 0.123 | 0.123 | .574** | ||||||||||
| DASS T2 | 0.335 | .355* | 0.283 | .502** | 0.344 | 0.344 | .574** | ||||||||||
| DFT T1 | .584** | .510** | .863** | .563** | -0.134 | -0.131 | .486** | 0.114 | |||||||||
| DFT T2 | .401* | .452** | .597** | .770** | -0.143 | -0.272 | 0.24 | 0.237 | |||||||||
| B T1 | .531** | .456** | .893** | .554** | -0.093 | 0.065 | .595** | 0.205 | |||||||||
| B T2 | .400* | .354* | .761** | .799** | 0.088 | 0.018 | 0.273 | 0.295 | |||||||||
| BD T1 | .554** | .460** | .934** | .678** | 0.052 | 0.198 | .450** | 0.34 | |||||||||
| BD T2 | 0.323 | .354* | .624** | .956** | -0.055 | 0.104 | 0.281 | .521** |
A further aim was to determine how the sub-scales of the EDI were correlated with the AQ. On both occasions, all sub-scales of the EDI were positively correlated with the AQ, as can be observed in Table 2. At T1, the strongest correlation was between BD and AQ scores and at T2 between Desire for Thinness (DFT) and AQ scores. All of these correlations were stronger at T1 than T2; however, a Fishers r-to-z transformation revealed that these differences in magnitude were not significant: DFT (Z=0.37, p= .711), B (Z=0.94, p= .347) and B (Z=1 .42, p= .156).
Firstly, a series of hierarchical multiple regressions were conducted to determine whether negative affect (as measured by the DASS) and autistic traits (as measured by the AQ) were significant predictors of eating-disordered attitudes (as measured by EDI). A Shapiro–Wilk revealed that assumptions of normality were met for all except the stated test. At T1, DASS (model 1) was entered at the first step and explained 32 per cent of the variance in scores on the EDI and was a significant predictor.
| β | t | R2 | R2 Change | |
| Time 1 (EDI 1= DV) | ||||
| Model 1 | 0.319 | |||
| DASS | .565** | 0.381 | ||
| Model 2 | 0.531 | .21*** | ||
| DASS | .347* | 2.51 | ||
| AQ | .510*** | 3.69 | ||
| Time 2 (EDI 2= DV) | ||||
| Model 1 | 0.268 | |||
| DASS | .518** | 3.369 | ||
| Model 2 | 0.356 | 0.088 | ||
| DASS | .415* | 2.677 | ||
| AQ | 0.314 | 2.023 | ||
| Time 1x2 (EDI 2=DV) | ||||
| Model 1 | 0.697 | |||
| EDI T1 | .835*** | 0.381 | ||
| Model 2 | 0.763 | 0.039 | ||
| EDI T1 | 1.00*** | |||
| DASS T1 | 0.011 | 0.092 | ||
| AQ T1 | -.263* | -2.065 |
The inclusion of AQ scores (model 2) accounted for an additional 21 per cent of variance in the dependent variable, leading to a significant increase in r2. In this final model, both predictor variables were statistically significant (see Figure 1 for a visual representation).
At T2, DASS (model 1), entered at the first step, explained 27 per cent of the variance in EDI scores. The inclusion of AQ scores (model 2) explained an additional 9 per cent of variance, and therefore did not lead to a statistically significant increase in r2 change. In the final model, AQ was not found to be a significant predictor whereas DASS was. These results imply that AQ scores may be more predictive of EDI scores when participants were in a state of stress as opposed to when they were not. However, the Shapiro–Wilk test for this second regression violated assumptions of normality; therefore, these results should be treated with caution.
The final hierarchical regression aimed to explore the extent to which negative affect and AQ scores at T1 would be able to predict EDI scores at T2, after controlling for initial EDI scores at T1. EDI scores at T1 (model 1) were entered at the first step and were found to significantly predict scores on the EDI at T2, as was expected. While the inclusion of DASS scores and AQ scores (model 2) did not lead to a significant increase in r2 change – only contributing an additional 4 per cent variance in the dependent variable – AQ scores at T1 entered as a significant predictor of EDI scores at T2, whereas DASS scores at T1 did not. This preliminarily indicates that it was the elevated autistic traits, as caused by the stress state at T1, that contributed towards the change in EDI scores between T1 and T2.
| β | t | R2 | R2 Change | ||
| DFT Time 1 | |||||
| Model 1 | 0.238 | ||||
| DASS T1 | .488** | 3.113 | |||
| Model 2 | 0.392 | .154** | |||
| DASS T1 | 0.302 | 1.92 | |||
| AQ T1 | .434** | 2.759 | |||
| DFT Time 2 | |||||
| Model 1 | 0.201 | ||||
| DASS T2 | .448** | 2.791 | |||
| Model 2 | 0.338 | .137* | |||
| DASS T2 | 0.32 | 2.036 | |||
| AQ T2 | .391* | 2.489 | |||
| B Time 1 | |||||
| Model 1 | 0.239 | ||||
| DASS T1 | .489** | 3.121 | |||
| Model 2 | 0.391 | .152** | |||
| EDI T1 | 0.305 | 1.934 | |||
| DASS T1 | .431** | 2.733 | |||
| B Time 2 | |||||
| Model 1 | 0.051 | ||||
| DASS T2 | 0.226 | 1.293 | |||
| Model 2 | 0.094 | 0.1 | |||
| DASS T2 | 0.117 | 0.656 | |||
| AQ T2 | 0.334 | 1.875 | |||
| BD Time 1 | |||||
| Model 1 | 0.307 | ||||
| DASS T1 | .554*** | 3.705 | |||
| Model 2 | 0.503 | .196** | |||
| EDI T1 | .345* | 2.42 | |||
| DASS T1 | .490** | 3.44 | |||
| BD Time 2 | |||||
| Model 1 | 0.411 | ||||
| DASS T2 | .641*** | 4.656 | |||
| Model 2 | 0.44 | 0.028 | |||
| DASS T2 | .583*** | 4.034 | |||
| AQ T2 | 1 .228 | 1.228 |
Hierarchical regressions were also performed to investigate the ability of AQ to predict scores on each sub-scale of the EDI after controlling for negative affect, and to determine if this relationship would differ between T1 and T2.
As shown in Table 3, Desire for Thinness was seen to have the strongest correlation with the AQ at T2. At T1, DASS scores (model 1) were entered at the first step and explained 24 per cent of variance, with the inclusion of AQ scores (model 2) accounting for an additional 15 per cent. In the final model, DASS was not a significant predictor, whereas AQ was. Similar findings were revealed at T2. DASS scores (model 1) were entered at the first step and accounted for 20 per cent of variance, with the inclusion of AQ scores (model 2) accounting for an additional 14 per cent of variance. In the final model, DASS was not a significant predictor, whereas AQ was.
As shown in Table 3, Body Dissatisfaction was seen to have the strongest correlation with AQ scores at T1. DASS scores (model 1) entered at the first step accounted for 30 per cent of the variance in EDI scores, with the inclusion of AQ scores (model 2) accounting for an additional 20 per cent of the variance and leading to a significant increase in r2. AQ and DASS scores entered as significant predictors. At T2, DASS scores (model 1) were entered at the first step and accounted for 41 per cent of variance. However, the inclusion of AQ scores (model 2) accounted for 3 per cent of additional variance, leading to no significant increase in r2. AQ scores did not enter as a significant predictor.
For Bulimia at T1, DASS scores (model 1) were entered at the first step and explained 24 per cent of variance. The inclusion of AQ scores (model 2) accounted for an additional 15 per cent of variance, meaning in the final model, DASS was not a significant predictor, whereas AQ was. At T2, DASS scores (model 1) were entered at the first step and accounted for 5 per cent of variance in the dependent variable. While the inclusion of AQ scores (model 2) accounted for an additional 10 per cent of variance, neither DASS nor AQ scores were significant predictors in the final model.
Previous research has demonstrated that clinical AN and ASD share cognitive and behavioural similarities (Zucker et al., 2007; Treasure, 2013), with 50 per cent of those with AN exhibiting a broader autism phenotype on the AQ (Baron-Cohen et al., 2013). The primary purpose of the present study was to expand upon these findings by investigating whether an association exists between disordered-eating attitudes and autistic traits in a non-clinical population, and if so, whether this association would strengthen or weaken in response to a naturally occurring state of examination stress. Our findings support the existence of this relationship, as levels of autistic traits during stress entered as a significant predictor of the change in disordered-eating attitudes, and were found to be positively correlated with eating attitudes on two distinct occasions. As this relationship was greater in magnitude during a state condition whereby the stress of participants was elevated, this supports the hypothesis that, in a non-clinical population, the relationship between disordered-eating attitudes and autistic traits is dependent upon the state of the individual as opposed to a lasting trait.
Firstly, based upon previous literature that indicates clinical AN and ASD may share some underlying endophenotype (Westwood and Tchanturia, 2017; Baron-Cohen et al., 2013; Zucker et al., 2007), we predicted that the relationship between the two disorders could be extended to a non-clinical sample of students. In line with Coombs et al.’s (2011) research linking ED symptomatology and autistic traits in a student population, we found that if participants scored higher on a measure of disordered-eating attitudes, they also scored higher on a test of autistic traits.
However, it currently remains unknown as to whether the existence of heightened autistic traits in individuals with anorexia ameliorate following recovery, or whether they are dependent upon their current ill state. In clinical samples, the relationship between ASD and AN is pervasive, yet can be exasperated through extreme starvation (Hiller and Pellicano, 2013), with studies revealing negative correlations between body mass and autistic traits (Zakzanis et al., 2010; Bolton et al., 2014). While this implies that the cognitive difficulties experienced by the individual should normalise upon weight restoration, contrasting studies have found that ToM difficulties and weak central coherence persist in individuals with anorexia post recovery (Oldershaw et al., 2010; Nilsson et al., 1999). Our study aimed to contribute towards knowledge in this area by exploring how the relationship between disordered-eating attitudes and autistic traits would differ during a state of elevated stress and when individuals were exhibiting their natural traits alone. Our analyses revealed that the correlation between these two constructs was considerably stronger when participants were experiencing exam stress, suggesting that this association, in a non-clinical sample, is dependent upon a psychological state. Additionally, scores on the AQ were found to significantly predict scores on the EDI, independent of negative affect, during the state condition alone, thus supporting the notion that the aforementioned association may be heightened by stress as opposed to being a permanent characteristic of the individual.
Expanding upon this, a regression analysis revealed that the level of autistic traits exhibited by participants when in a state of elevated stress was a significant predictor of lower disordered-eating attitudes when participants were not in this state. This means that the higher an individual scored on the AQ at T1, the lower they scored on the EDI at T2. This predictive ability also held even when controlling for original levels of disordered-eating attitudes and negative affect. These findings support the hypothesis that the relationship between disordered-eating attitudes and autistic traits is dependent upon the state of the individual, as stress-induced autistic traits were found to be a driving force in the changes in levels of disordered-eating attitudes. However, with no previous research exploring this notion, these findings are tentative and must be regarded with caution.
While the main investigation described above supports findings from previous literature, our exploration into the effects of cognitive inflexibility on disordered-eating attitudes and autistic traits appeared to be antithetical. Research has demonstrated that autistic individuals consistently perform poorly on empirical tests of set-shifting, including the Wisconsin Card Sorting Test (Ozonoff and Jensen, 1999; Prior and Hoffmann, 1990) and the Intradimensional–Extradimensional Shift Task (Hughes, Russell and Robbins, 1994). Similarly, the Brixton test itself has been used to confirm set-shifting difficulties in individuals with anorexia (Tchanturia et al., 2011; Tchanturia et al., 2004). These studies strongly indicate that there is a shared deficit regarding cognitive inflexibility between both spectrums of disorders. However, no correlation was found on any occasion between disordered-eating attitudes or autistic traits and set-shifting ability.
There are two possible accounts for this unexpected finding. Firstly, a previous study conducted by Murphy (2011) also failed to find a significant correlation between the AQ and the Brixton task. Although the Wisconsin and Intra–Extradimensional tasks have been shown to adequately measure set-shifting difficulties in autistic samples, it is possible to hypothesise that, due to its inability to replicate such results, the Brixton may not be an adequate measure of cognitive inflexibility in autistic-trait individuals. Secondly, Coombs et al.’s (2011) study exploring the relationship between eating-disorder symptomatology and autistic traits in a non-clinical sample found that the sub-scales of the AQ that represented set-shifting were not well-correlated with scores on the EAT-26. This led the authors to hypothesise that the association between impaired set-shifting and disordered-eating behaviour did not emerge due to the use of a non-clinical sample. It could therefore be proposed that the relationship between eating attitudes, autistic traits and cognitive inflexibility may only emerge in severe cases of AN and ASD.
The final purpose of the present study was to examine how specific aspects of eating-disorder symptomatology, as measured by sub-scales of the EDI, were related to autistic traits and change in response to stress. This is of particular interest as, although the relationship between AN and ASD has been established, limited research has been conducted into the relationship between unique aspects of disordered-eating attitudes and ASD. Firstly, bulimic individuals have been shown to score higher than controls on the AQ (Gesi et al., 2017), with Lopez et al. (2009) also demonstrating that they exhibit weak central coherence and difficulties regarding set-shifting on a battery of tests. However, our findings revealed that the bulimia sub-scale had the weakest correlation with autistic traits on both occasions and held little predictive value. In reference to body dissatisfaction, there is support for the notion that individuals with ASD may be at an increased risk to negatively experience and evaluate their bodies (Krumm, Ferraro and Ingvalson, 2017), implying that scores on this construct should positively correlate with AQ scores. This is supported by our results, as body dissatisfaction was found to show the strongest correlation to autistic traits when participants were stressed. However, with limited research existing, these findings can only be applied to our specific sample of university students, who have been found to exhibit higher levels of body dissatisfaction in general (Ansari et al., 2014).
The limitations associated with the present study may account for the fact that, although some statistical tests were approaching significance, they failed to reach it at a .05 alpha level. Without significance, the observed relationships cannot be considered highly credible. However, as our analyses did reveal sizeable differences between testing periods, it is possible to argue that the use of such a small sample greatly increased the margin of error, whereas a larger sample size would narrow the distribution of the test statistic and increase its ability to detect an effect. Further, the differences in scores could also be accounted for by practice effects.
Similarly, using a small non-clinical sample limits the spread of results on the EDI and AQ. As few individuals presented high scores on these measures, the results bear little application to those with a diagnosis of AN, and cannot be generalised to a clinical field. While it is important that university students are studied as they are at an increased risk for the development of eating disorders (Hoek and van Hoeken, 2003), the use of a student sample does not render great application.
Finally, this was a self-report study, relying on participants to accurately detail their emotions retrospectively. While the AQ, EDI and DASS are valid and reliable measures of their respective constructs (see Methodology for alpha levels), self-report scales can be easily influenced by social desirability and retrospective reporting bias. Similarly, asking individuals with heightened cognitive difficulties to report on their own attitudes can also become concerning as this may impair their self-awareness. Further, Likert scales, an ordinal psychometric measure of attitudes and behaviour, do not reflect the multi-dimensional nature of emotional states, and thus the distance between ratings may not accurately represent reality.
Firstly, replicating this study using a larger number of participants may increase the effect size and enable the current findings of this study to reach the point of statistical significance. This should therefore be the primary focus of future research. Secondly, replicating this study using a clinical sample could have great implications regarding the diagnostic process and treatment of both AN and ASD. Should it be found that elevated autistic traits are a lasting psychological feature in individuals with AN, then treatments could be developed to target these characteristics so as to reduce overall symptoms. In contrast, should this relationship be revealed as state-dependent, preventative measures could be put in place at times when individuals are most vulnerable to the psychological effects of stress. Regardless, the implications of the present study indicate that treatment of AN should also prioritise the cognitive profile (autistic traits) of patients, not just their behaviour.
Finally, it would be interesting to explore, through longitudinal research, how the state vs trait relationship between AN and ASD differs between males and females. An altered phenotypic profile of autism for females is supported by 78.8 per cent of studies (Kirkovski, Enticott and Fitzgerald, 2013), and researchers have gone as far as to hypothesise that AN may be the female phenotype of ASD (Treasure, 2013). Recording gender-based differences in research such as this may inform knowledge regarding the differing presentation of ASD in males and females and how the symptomatology presented by both genders may differ in response to stress.
This study has demonstrated that there is a relationship between disordered-eating attitudes and autistic traits in a non-clinical, university student cohort. Further, it was found that this relationship was stronger during a state of elevated stress as opposed to when individuals were presenting their natural traits, and that stress-induced (state) autistic traits were significantly predictive of changes in eating disordered attitudes. However, this relationship was not found to be affected by cognitive inflexibility, as measured by the Brixton, which was not related to either disordered-eating behaviour or autistic traits.
These findings suggest that elevated autistic traits in individuals who are exhibiting disordered-eating attitudes may be a reflection of their current state, and may therefore ameliorate when eating-disorder symptomatology does so. Further, they demonstrate that the association found in clinical patients exists in non-clinical populations also. This suggests that exploring these populations can provide critical insight into mechanisms underpinning disordered-eating psychopathology before the clinical onset of anorexia. This project has further highlighted the need for research exploring the exact mechanisms shared between AN and ASD so as to provide insight into more effective diagnosis and treatment interventions.
American Psychiatric Association. (2013), Diagnostic and Statistical Manual of Mental Disorders. (5th Ed.), Arlington, VA: American Psychiatric Publishing
Ansari, W., E. Dibba and C. Stock (2014), ‘Body image concerns: Levels, correlates and gender differences among students in the United Kingdom’. Central European Journal of Public Health, 22 (2), 106–17
Antony, M., P. Bieling, B. Cox, M. Enns and R. Swinson (1998), ‘Psychometric properties of the 42-item and 21-item versions of the Depression Anxiety Stress Scales in clinical groups and a community sample’. Psychological Assessment, 10(2): 176–81
Baron, M., J. Groden, G. Groden and L. Lipsitt (2006), Stress and Coping in Autism. Oxford, UK: Oxford University Press
Baron-Cohen, S., T. Jaffa, S. Davies, B. Auyeung, C. Allison and S. Wheelwright (2013), ‘Do girls with anorexia nervosa have elevated autistic traits?’ Molecular Autism, 4(1): 24
Baron-Cohen, S., S. Wheelwright, R. Skinner, J. Martin and E. Clubley (2001), ‘The autism-spectrum quotient (AQ): Evidence from Asperger syndrome/high-functioning autism, males and females, scientists and mathematicians’. Journal of Autism and Developmental Disorders, 31(1): 5–17
Bolton, H., P. Burgess, S. Gilbert and L. Serpell (2014), ‘Increased set shifting costs in fasted healthy volunteers’. Plos ONE, 9(7): e101946
Burgess, P. and T. Shallice (1997), The Hayling and Brixton Tests. Test manual. Bury St Edmunds, UK: Thames Valley Test Company
Chaplin, W., O. John and L. Goldberg (1988), ‘Conceptions of states and traits: Dimensional attributes with ideals as prototypes’. Journal of Personality and Social Psychology, 54(4): 541–57
Constantino, J. and R. Todd (2003), ‘Autistic traits in the general population’. Archives of General Psychiatry, 60(5): 524
Coombs, E., M. Brosnan, R. Bryant-Waugh and S. Skevington (2011), ‘An investigation into the relationship between eating disorder psychopathology and autistic symptomatology in a non-clinical sample’. British Journal of Clinical Psychology, 50(3): 326–38
Craik, F. and B. Levine (2012), Mind and the Frontal Lobes. Oxford, UK: Oxford University Press
Dichter, G., K. Radonovich, L. Turner-Brown, K. Lam, T. Holtzclaw and J. Bodfish (2009), ‘Performance of children with autism spectrum disorders on the dimension-change card sort task’. Journal of Autism and Developmental Disorders, 40(4): 448–56
Frith, U. (1989), Autism: Explaining the Enigma. Oxford, UK: Blackwell
Garner, D. M. (1991), Eating Disorder Inventory-2. Professional manual. Florida, US: Psychological Assessment Research, Inc
Gesi, C., C. Carmassi, M. Luciano, L. Bossini, V. Ricca and A. Fagiolini, M. Maj and L. Dell’Osso (2017), ‘Autistic traits in patients with anorexia nervosa, bulimia nervosa or binge eating disorder: A pilot study’. European Psychiatry, 41: 100
Gillberg, C. (1983), ‘Are autism and anorexia nervosa related?’. The British Journal of Psychiatry, 142(4): 428
Gillberg, C. and M. Råstam (1992), ‘Do some cases of anorexia nervosa reflect underlying autistic-like conditions?’. Behavioural Neurology, 5(1): 27–32
Gillberg, C., C. Gillberg, M. Råstam and M. Johansson (1996), ‘The cognitive profile of anorexia nervosa: A comparative study including a community-based sample’. Comprehensive Psychiatry, 37(1): 23–30
Gioia, G., P. Isquith, L. Kenworthy and R. Barton (2002), ‘Profiles of everyday executive function in acquired and developmental disorders’. Child Neuropsychology, 8(2): 121–37
Groden, J., A. Diller, M. Bausman, W. Velicer, G. Norman and J. Cautela (2001), ‘The development of a stress survey schedule for persons with autism and other developmental disabilities’. Journal of Autism and Developmental Disorders, 31(2): 207–17
Groden, J., S. Prince, J. Cautela and J. Berryman (1994), ‘The impact of stress and anxiety on individuals with autism and developmental disabilities’. Behavioral Issues in Autism, 117–94, DOI:10.1007/978-1-4757-9400-7_9
Hiller., R and E. Pellicano (2013), ‘Anorexia and autism—a cautionary note’. The Psychologist, 26(11): 1
Hoek, H., and D. van Hoeken (2003), ‘Review of the prevalence and incidence of eating disorders’. International Journal of Eating Disorders, 34(4): 383–96
Holliday, J., K. Tchanturia, S. Landau, D. Collier and J. Treasure (2005), ‘Is impaired set-shifting an endophenotype of anorexia nervosa?’. American Journal of Psychiatry, 162(12): 2269–75
Hughes, C., J. Russell and T. Robbins (1994), ‘Evidence for executive dysfunction in autism’. Neuropsychologia, 32(4): 477–92
Huke, V., J. Turk, S. Saeidi, A. Kent and J. Morgan (2013), Autism spectrum disorders in eating disorder populations: A systematic review. European Eating Disorders Review, 21(5): 345–51
Jacobi, C., C. Hayward, M. de Zwaan, H. Kraemer and W. Agras (2004), ‘Coming to terms with risk factors for eating disorders: Application of risk terminology and suggestions for a general taxonomy. Psychological Bulletin, 130(1): 19–65
Karlsson, L., M. Råstam and E. Wentz (2013), ‘The Swedish eating assessment for autism spectrum disorders (SWEAA)—Validation of a self-report questionnaire targeting eating disturbances within the autism spectrum’. Research on Developmental Disabilities, 34(7): 2224–33
Kirkovski, M., P. Enticott and P. Fitzgerald (2013), ‘A review of the role of female gender in autism spectrum disorders’. Journal of Autism and Developmental Disorders, 43(11): 2584–603
Krumm, A., F. Ferraro and B. Ingvalson (2017), ‘Exploring the relationship between autistic traits and body image, body satisfaction, and body competence’. The Journal of Psychology, 151(6): 566–79
Lang, K., S. Lloyd, M. Khondoker, M. Simic, J. Treasure and K. Tchanturia (2015), ‘Do children and adolescents with anorexia nervosa display an inefficient cognitive processing style?’. PLOS ONE, 10(7): e0131724
Lopez, C., K. Tchanturia, D. Stahl and J. Treasure (2009), ‘Weak central coherence in eating disorders: A step towards looking for an endophenotype of eating disorders’. Journal of Clinical and Experimental Neuropsychology, 31(1): 117–25
Lounes, N., G. Khan and K. Tchanturia (2011), Assessment of cognitive flexibility in anorexia nervosa – self-report or experimental measure? A brief report’. Journal of the International Neuropsychological Society, 17(5): 925–28
Lovibond, S. H. and P. F. Lovibond (1995), Manual for the Depression Anxiety Stress Scales. (2nd ed.) Sydney, Australia: Psychology Foundation
Macht, M., C. Haupt and H. Ellgring (2005), ‘The perceived function of eating is changed during examination stress: A field study’. Eating Behaviors, 6(2): 109–12
Mayhew, R., and R. Edelmann (1989), ‘Self-esteem, irrational beliefs and coping strategies in relation to eating problems in a non-clinical population’. Personality and Individual Differences, 10(5): 581–84
Miyake, A., N. Friedman, M. Emerson, A. Witzki, A. Howerter and T. Wager (2000), ‘The unity and diversity of executive functions and their contributions to complex “frontal lobe” tasks: A latent variable analysis’. Cognitive Psychology, 41(1): 49–100
Murphy, D. (2011), ‘Autism spectrum quotient (AQ) profiles among male patients within high security psychiatric care: Comparison with personality and cognitive functioning’. Journal of Forensic Psychiatry and Psychology, 22(4): 518–34
Nilsson, E., C. Gillberg, I. Gillberg and M. Råstam (1999), ‘Ten-year follow-up of adolescent-onset anorexia nervosa: personality disorders’. Journal of the American Academy of Child and Adolescent Psychiatry, 38(11): 1389–95
Oldershaw, A., D. Hambrook, K. Tchanturia, J. Treasure and U. Schmidt (2010), ‘Emotional theory of mind and emotional awareness in recovered anorexia nervosa patients’. Psychosomatic Medicine, 72(1): 73–79
Oldershaw, A., J. Treasure, D. Hambrook, K. Tchanturia and U. Schmidt (2011), ‘Is anorexia nervosa a version of autism spectrum disorders?’. European Eating Disorders Review, 19(6): 462–74
Osterrieth, P. A. (1944), ‘Le test de copie d’une figure complexe’. Archives de Psychologie, 30: 206–356
Ozonoff, S., and Jensen, J. (1999), ‘Brief report: Specific executive function profiles in three neurodevelopmental disorders’. Journal of Autism and Developmental Disorders, 29 (2), 171–77
Prior, M., and W. Hoffmann (1990), ‘Brief report: Neuropsychological testing of autistic children through an exploration with frontal lobe tests’. Journal of Autism and Developmental Disorders, 20(4): 581–90
Råstam, M. (2008), ‘Eating disturbances in autism spectrum disorders with focus on adolescent and adult years’. Clinical Neuropsychiatry: Journal of Treatment Evaluation, 5(1): 31–42
Roberts, M., K. Tchanturia, D. Stahl, L. Southgate and J. Treasure (2007), ‘A systematic review and meta-analysis of set-shifting ability in eating disorders’. Psychological Medicine, 37(8): 1075
Rothery, D., and G. Garden (1988), ‘Anorexia nervosa and infantile autism’. British Journal of Psychiatry, 153(5): 714
Schoemaker, C., T. van Strien and van der Staak, C. (2010), ‘Validation of the eating disorders inventory in a nonclinical population using transformed and untransformed responses’. International Journal of Eating Disorders, 15(4): 387–93
Shatford, L. A. and D. R. Evans (1986), ‘Bulimia as a manifestation of the stress process: A LISREL causal modeling analysis’. International Journal of Eating Disorders, 5: 451–73
Stewart, M. and E. Austin (2009), ‘The structure of the Autism-Spectrum Quotient (AQ): Evidence from a student sample in Scotland’. Personality and Individual Differences, 47(3): 224–28
Tachikawa, H., N. Yamaguchi, K. Hatanaka, J. Kobayashi, S. Sato, K. Mizukami, T. Asada and M. Sugie (2004), ‘The Eating Disorder Inventory-2 in Japanese clinical and non-clinical samples: Psychometric properties and cross-cultural implications’. Eating and Weight Disorders: Studies on Anorexia, Bulimia and Obesity, 9(2): 107–13
Tchanturia, K., M. Anderluh, R. Morris, S. Rabe-Hesketh, D. Collier, P. Sanchez and J. Treasure (2004), ‘Cognitive flexibility in anorexia nervosa and bulimia nervosa’. Journal of the International Neuropsychological Society, 10(4): 513–20
Tchanturia, K., R. Morris, M. Anderluh, D. Collier, V. Nikolaou and J. Treasure (2004), ‘Set shifting in anorexia nervosa: an examination before and after weight gain, in full recovery and relationship to childhood and adult OCPD traits’. Journal of Psychiatric Research, 38(5): 545–52
Tchanturia, K., A. Harrison, H. Davies, M. Roberts, A. Oldershaw, M. Nakazato, D. Stahl, R. Morris, U. Schmidt and J. Treasure (2011), ‘Cognitive flexibility and clinical severity in eating disorders’. Plos ONE, 6(6): e20462
Treasure, J. (2013), ‘Coherence and other autistic spectrum traits and eating disorders: Building from mechanism to treatment. The Birgit Olsson lecture’. Nordic Journal of Psychiatry, 67(1): 38–42
Westwood, H., and K. Tchanturia (2017), ‘Autism spectrum disorder in anorexia nervosa: An updated literature review’. Current Psychiatry Reports, 19(7): 41
Wolf, E. M., and J. H. Crowther (1983), ‘Personality and eating habit variables as predictors of severity of binge-eating and weight’. Addictive Behaviors, 8: 335–44
Yerys, B., G. Wallace, B. Harrison, M. Celano, J. Giedd and L. Kenworthy (2009), ‘Set-shifting in children with autism spectrum disorders’. Autism, 13(5): 523–38
Zakzanis, K., Z. Campbell, and A. Polsinelli (2010), ‘Quantitative evidence for distinct cognitive impairment in anorexia nervosa and bulimia nervosa’. Journal of Neuropsychology, 4(1): 89–106
Zucker, N., M. Losh, C. Bulik, K. LaBar, J. Piven and K. Pelphrey (2007), ‘Anorexia nervosa and autism spectrum disorders: Guided investigation of social cognitive endophenotypes’. Psychological Bulletin, 133(6): 976–1006
Attitudes towards eating and appearance
The following items ask about your own attitudes, feelings and behaviour. The items relate to food or eating.
For each item, decide if the item is true about you ALWAYS (A), USUALLY (U), OFTEN (O), SOMETIMES (S), RARELY (R), or NEVER (N). Circle the letter that corresponds to your rating. For example, if your rating for an item is OFTEN, you would circle the (O) for that item. Try to respond to all of the items, making sure that you circle the letter for the rating that is true about you.
| 1) I eat sweets and carbohydrates without feeling nervous | A U O S R N |
| 2) I think that my stomach is too big | A U O S R N |
| 3) I eat when I am upset | A U O S R N |
| 4) I stuff myself with food | A U O S R N |
| 5) I think about dieting | A U O S R N |
| 6) I think that my thighs are too large | A U O S R N |
| 7) I feel extremely guilty after overeating | A U O S R N |
| 8) I think that my stomach is just the right size | A U O S R N |
| 9) I am terrified of gaining weight | A U O S R N |
| 10) I feel satisfied with the shape of my body | A U O S R N |
| 11) I exaggerate or magnify the importance of weight | A U O S R N |
| 12) I have gone on eating binges where I have felt that I could not stop | A U O S R N |
| 13) I like the shape of my buttocks | A U O S R N |
| 14) I am preoccupied with the desire to be thinner | A U O S R N |
| 15) I think about bingeing (overeating) | A U O S R N |
| 16) I think my hips are too big | A U O S R N |
| 17) I eat moderately in front of others and stuff myself when they’re gone | A U O S R N | 18) If I gain a pound, I worry that I will keep gaining | A U O S R N |
| 19) I have the thought of trying to vomit to lose weight | A U O S R N |
| 20) I think that my thighs are just the right size | A U O S R N |
| 21) I think my buttocks are too large | A U O S R N |
| 22) I eat or drink in secrecy | A U O S R N |
| 23) I think that my hips are just the right size | A U O S R N |
The Adult Autism Spectrum Quotient (AQ)
How to fill out the questionnaire
Below are a list of statements. Please read each statement very carefully and rate how strongly you agree or disagree with it by circling your answer.
DO NOT MISS ANY STATEMENT OUT.
Examples
| 1. I prefer to do things with others rather than on my own. | definitely agree | slightly agree | slightly disagree | definitely disagree |
| 2. I prefer to do things the same way over and over again. | definitely agree | slightly agree | slightly disagree | definitely disagree |
| 3. If I try to imagine something, I find it very easy to create a picture in my mind. | definitely agree | slightly agree | slightly disagree | definitely disagree |
| 4. I frequently get so strongly absorbed in one thing that I lose sight of other things. | definitely agree | slightly agree | slightly disagree | definitely disagree |
| 5. I often notice small sounds when others do not. | definitely agree | slightly agree | slightly disagree | definitely disagree |
| 6. I usually notice car number plates or similar strings of information. | definitely agree | slightly agree | slightly disagree | definitely disagree |
| 7. Other people frequently tell me that what I’ve said is impolite, even though I think it is polite. | definitely agree | slightly agree | slightly disagree | definitely disagree |
| 8. When I’m reading a story, I can easily imagine what the characters might look like. | definitely agree | slightly agree | slightly disagree | definitely disagree |
| 9. I am fascinated by dates. | definitely agree | slightly agree | slightly disagree | definitely disagree |
| 10. In a social group, I can easily keep track of several different people’s conversations. | definitely agree | slightly agree | slightly disagree | definitely disagree |
| 11. I find social situations easy. | definitely agree | slightly agree | slightly disagree | definitely disagree |
| 12. I tend to notice details that others do not. | definitely agree | slightly agree | slightly disagree | definitely disagree |
| 13. I would rather go to a library than a party. | definitely agree | slightly agree | slightly disagree | definitely disagree |
| 14. I find making up stories easy. | definitely agree | slightly agree | slightly disagree | definitely disagree |
| 15. I find myself drawn more strongly to people than to things. | definitely agree | slightly agree | slightly disagree | definitely disagree |
| 16. I tend to have very strong interests which I get upset about if I can’t pursue. | definitely agree | slightly agree | slightly disagree | definitely disagree |
| 17. I enjoy social chit-chat. | definitely agree | slightly agree | slightly disagree | definitely disagree |
| 18. When I talk, it isn’t always easy for others to get a word in edgeways. | definitely agree | slightly agree | slightly disagree | definitely disagree |
| 19. I am fascinated by numbers. | definitely agree | slightly agree | slightly disagree | definitely disagree |
| 20. When I’m reading a story, I find it difficult to work out the characters’ intentions. | definitely agree | slightly agree | slightly disagree | definitely disagree |
| 21. I don’t particularly enjoy reading fiction. | definitely agree | slightly agree | slightly disagree | definitely disagree |
| 22. I find it hard to make new friends. | definitely agree | slightly agree | slightly disagree | definitely disagree |
| 23. I notice patterns in things all the time. | definitely agree | slightly agree | slightly disagree | definitely disagree |
| 24. I would rather go to the theatre than a museum. | definitely agree | slightly agree | slightly disagree | definitely disagree |
| 25. It does not upset me if my daily routine is disturbed. | definitely agree | slightly agree | slightly disagree | definitely disagree |
| 26. I frequently find that I don’t know how to keep a conversation going. | definitely agree | slightly agree | slightly disagree | definitely disagree |
| 27. I find it easy to ‘read between the lines‘ when someone is talking to me. | definitely agree | slightly agree | slightly disagree | definitely disagree |
| 28. I usually concentrate more on the whole picture, rather than the small details. | definitely agree | slightly agree | slightly disagree | definitely disagree |
| 29. I am not very good at remembering phone numbers. | definitely agree | slightly agree | slightly disagree | definitely disagree |
| 30. I don’t usually notice small changes in a situation, or a person’s appearance. | definitely agree | slightly agree | slightly disagree | definitely disagree |
| 31. I know how to tell if someone listening to me is getting bored. | definitely agree | slightly agree | slightly disagree | definitely disagree |
| 32. I find it easy to do more than one thing at once. | definitely agree | slightly agree | slightly disagree | definitely disagree |
| 33. When I talk on the phone, I’m not sure when it’s my turn to speak. | definitely agree | slightly agree | slightly disagree | definitely disagree |
| 34. I enjoy doing things spontaneously. | definitely agree | slightly agree | slightly disagree | definitely disagree |
| 35. I am often the last to understand the point of a joke. | definitely agree | slightly agree | slightly disagree | definitely disagree |
| 36. I find it easy to work out what someone is thinking or feeling just by looking at their face. | definitely agree | slightly agree | slightly disagree | definitely disagree |
| 37. If there is an interruption, I can switch back to what I was doing very quickly. | definitely agree | slightly agree | slightly disagree | definitely disagree |
| 38. I am good at social chit-chat. | definitely agree | slightly agree | slightly disagree | definitely disagree |
| 39. People often tell me that I keep going on and on about the same thing. | definitely agree | slightly agree | slightly disagree | definitely disagree |
| 40. When I was young, I used to enjoy playing games involving pretending with other children. | definitely agree | slightly agree | slightly disagree | definitely disagree |
| 41. I like to collect information about categories of things (e.g. types of car, types of bird, types of train, types of plant, etc.). | definitely agree | slightly agree | slightly disagree | definitely disagree |
| 42. I find it difficult to imagine what it would be like to be someone else. | definitely agree | slightly agree | slightly disagree | definitely disagree |
| 43. I like to plan any activities I participate in carefully. | definitely agree | slightly agree | slightly disagree | definitely disagree |
| 44. I enjoy social occasions. | definitely agree | slightly agree | slightly disagree | definitely disagree |
| 45. I find it difficult to work out people’s intentions. | definitely agree | slightly agree | slightly disagree | definitely disagree |
| 46. New situations make me anxious. | definitely agree | slightly agree | slightly disagree | definitely disagree |
| 47. I enjoy meeting new people. | definitely agree | slightly agree | slightly disagree | definitely disagree |
| 48. I am a good diplomat. | definitely agree | slightly agree | slightly disagree | definitely disagree |
| 49. I am not very good at remembering people’s date of birth. | definitely agree | slightly agree | slightly disagree | definitely disagree |
| 50. I find it very easy to play games with children that involve pretending. | definitely agree | slightly agree | slightly disagree | definitely disagree |
Anorexia nervosa: Anorexia nervosa (AN) is an eating disorder primarily affecting adolescent girls and young women, characterized by pathological fear of becoming fat, distorted body image, excessive dieting and emaciation.
Assumptions of normality: Assumption of normality claims that the sampling distribution of the mean is normal or that the distribution of means across samples is normal.
Autism spectrum disorder: Autism spectrum disorder (ASD) is a developmental disability. People with ASD often have problems with social communication and interaction, and restricted or repetitive behaviours or interests. People with ASD may also have different ways of learning, moving or paying attention.
Cronbach’s α: Cronbach's alpha is a way of assessing reliability by comparing the amount of shared variance, or covariance, among the items making up an instrument to the amount of overall variance.
Endophenotypes: Endophenotypes are heritable traits that are derived from laboratory measures such as electroencephalographic anomalies, neurocognitive performance deficits and impaired facial emotion recognition.
Fishers transformation: The Fisher Z-Transformation is a way to transform the sampling distribution of Pearson’s r (i.e. the correlation coefficient) so that it becomes normally distributed. The “z” in Fisher Z stands for a z-score.
Forced-choice format: A forced-choice question forces survey participants to select an option from the given choices. It does not have options that let the respondents skip the question without submitting their concrete opinion.
Intradimensional–Extradimensional Shift Task: This is a test of rule acquisition and reversal. It features visual discrimination and attentional set formation maintenance, shifting and flexibility of attention. This test is sensitive to changes in the fronto-striatal areas of the brain and is a computerised analogue of the Wisconsin Card Sorting Test.
Rey–Osterrieth Complex Figure Test: The Rey–Osterrieth complex figure (ROCF) is a neuropsychological assessment in which examinees are asked to reproduce a complicated line drawing, first by copying it freehand (recognition), and then drawing from memory (recall).
Set-shifting: Set-shifting is an executive function that involves the ability to unconsciously shift attention between one task and another.
Spearman’s rho: Spearman's rank correlation coefficient is a nonparametric measure of rank correlation (statistical dependence between the rankings of two variables). It assesses how well the relationship between two variables can be described using a monotonic function.
State-dependent: A state on the other hand is a temporary condition that they are experiencing for a short period of time. After the state has passes, they will return to another condition. If a behaviour is state-dependent, then they will reduce as the state subsides.
Theory of Mind: Theory of Mind refers to the capacity to understand other people by ascribing mental states to them. A Theory of Mind includes the knowledge that others' beliefs, desires, intentions, emotions, and thoughts may be different from one's own.
Trait-dependent: A trait is considered to be something that is part of an individual’s personality and therefore a long-term characteristic of an individual that shows through their behaviour, actions and feelings. It seen as being a characteristic, feature or quality of an individual. If a behaviour is trait-dependent, it will continue after a state subsides.
Visuospatial test: A visual-spatial test assesses your ability to mentally manipulate 3D objects.
Weak central coherence theory: The term “central coherence” refers to the “neurotypical” ( i.e., non-autistic) tendency to pull information together and process information in context, looking for the “big picture” and drawing out meaning, often at the expense of details. By contrast, “weak central coherence” refers to the tendency in ASD to attend to and remember details rather than global form or meaning.
Wisconsin Card Sorting Task: The Wisconsin Card Sorting Test (WCST) is a neuropsychological test that is frequently used to measure such higher-level cognitive processes as attention, perseverance, working memory, abstract thinking and set-shifting. Stimulus cards are shown to the participant and the participant is then instructed to match the cards. They are not given instructions on how to match the cards but are given feedback when the matches they make are right or wrong.
To cite this paper please use the following details: Law, N. (2023), 'The Impact of Exam Stress on the Relationship Between Autistic Traits and Disordered-Eating Attitudes in a Non-clinical Population', Reinvention: an International Journal of Undergraduate Research, Volume 16, Issue 2, https://reinventionjournal.org/article/view/783. Date accessed [insert date]. If you cite this article or use it in any teaching or other related activities please let us know by e-mailing us at Reinventionjournal@warwick.ac.uk.