| Genre | Artists | Songs | Songs in Training Set |
| Country | 52 | 2492 | 1993 |
| Dance | 49 | 2289 | 1831 |
| Hip Hop | 61 | 2182 | 1745 |
| Jazz | 56 | 2168 | 1734 |
| Pop | 50 | 2391 | 1912 |
| R&B | 56 | 2019 | 1615 |
| Reggae | 58 | 2060 | 1648 |
| Religious | 54 | 2825 | 2260 |
| Rock | 52 | 2990 | 2392 |
| Total | 488 | 21,416 | 17,130 |
These lyrics were collected by scraping the lyric website Genius and storing them into individual .txt files, filtering out files that do not contain any text. As Genius has no standard for tagging lyrics with genres, each set of lyrics was tagged with a genre based upon individual record label data found online. The resulting dataset used in this paper is approximately 34MB.
Preprocessing
Several preprocessing steps were performed in Python to clean the lyrics before features could be extracted. Firstly, text within square brackets was removed as this is commonly used to indicate comments on Genius. At this point, features that do not rely on pronunciation are calculated.
Punctuation was then removed, and the lyrics converted to lowercase. Methods to convert the text into a list of tokens (words) and into IPA (International Phonetic Alphabet) were also written, as these would be needed for some features. The CMU Pronouncing Dictionary was used to obtain American-English IPA translations. The remaining features were then calculated.
Lyric features
A total of 47 different features were constructed for the genre classification of lyrics, alongside a further 170 binary features to indicate whether certain words were present in the text. These features were grouped into four abstract sets: textual statistics, syllabic and rhyming features, vocabulary, and structural features.
Textual statistics
Textual statistical features are those that can be obtained by counting simple occurrences or patterns within the text. In this paper, these features are: total words, unique words, total characters, unique characters, total punctuation, unique punctuation, total numbers, total letters and total lines. From these features, we also calculated average words per line and average characters per word. In total, 11 textual statistics were used.
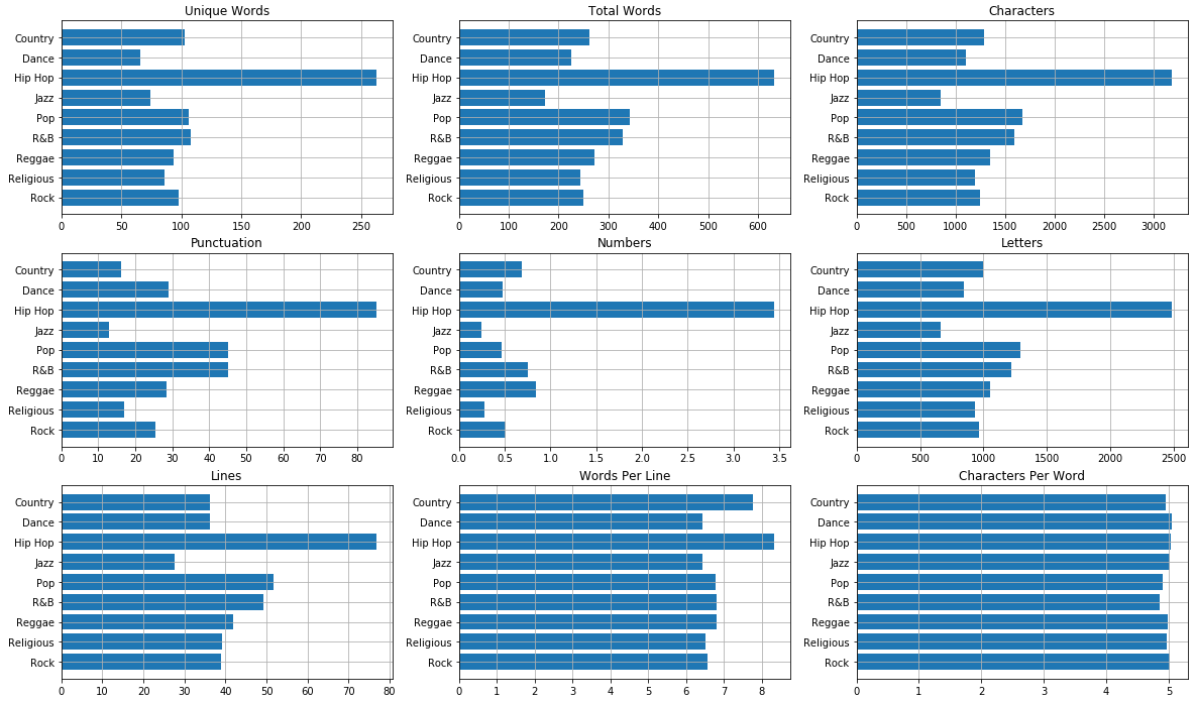
Many of the features in Figure 1 correlate with the length of the lyrics. Hip hop has the highest mean in eight of the nine shown features, which is to be expected as hip hop lyrics are typically rapped, and thus have more words and lines. Jazz lyrics are the shortest when measured by features such as total words and total characters; however, dance lyrics are the shortest when measured by unique words. This is likely due to the high repetitiveness of dance lyrics, causing fewer unique words.
While these textual statistics may not be useful to differentiate between some genres, it is easy to differentiate between genres such as hip hop, dance and jazz due to the lengths of the lyrics.
Syllabic and rhyming features
Syllabic and rhyming features are those that directly relate to the IPA representation of words or syllables in the text. These are total syllables, average syllables per word, average syllables per line, and Flesch reading ease (Flesch, 1948). Flesch reading ease, as a measure of readability, quantifies how difficult a text is to understand in English.
Different genres can be defined by different musical rhythms, and the use of syllabic features could allow us to detect these different rhythms. Readability, measured through Flesch reading ease, also allows us to combine syllabic and vocabulary metrics – where, for example, dance lyrics might be more readable due to the repetitive use of simplistic words.
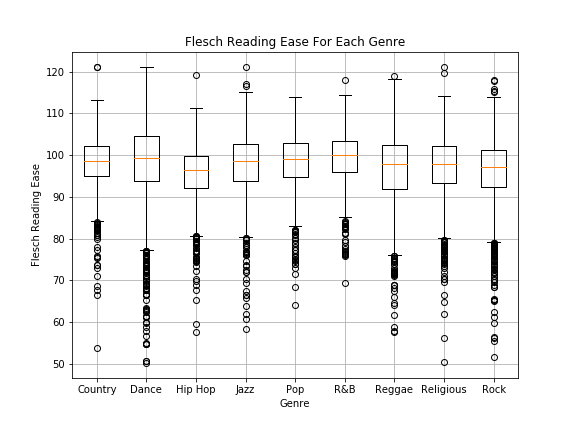
The range for Flesch reading ease, when excluding outliers, varies depending on the genre. R&B lyrics have the highest mean and the smallest range, highlighting that they are usually more readable than the lyrics of other genres. In contrast, approximately 75 per cent of hip hop lyrics are less readable than the average R&B lyrics. Reggae and rock lyrics are also likely to have a lower readability.
Rhyming features, which are dependent on the IPA conversion, are also included here. Rhyming within this paper refers to assonance, the repeated occurrence of similar vowel phonemes. Other types of rhyming – such as perfect rhymes, consonance and alliteration – were considered; however, assonance is prevalent in many genres of music such as hip hop and pop.
Rhyming features used in this paper include those that count the number of rhyming couplets or blocks. The different rhyming blocks detected were AA, AABB, ABAB, ABBA and AAAA rhyme patterns. The number of occurrences for each of these rhyme patterns, as well as the total number of quatrain rhyming blocks, were used as features.
Malmi Rhyme Factor (Malmi et al., 2016) was used as a separate feature. While the previously constructed features can detect end-rhymes, Malmi Rhyme Factor can detect rhyming in different positions of lines and calculates an overall value for the density of rhyming. Malmi et al. notes that this feature has particular use with hip hop lyrics and used it to rank songs based upon their density of rhyme. This feature has not been used in existing work of music-genre classification for lyrics.
Vocabulary
We assume that different genres make use of different words. Features based upon this assumption can be constructed by using TF-IDF to extract words that are more frequent in certain genres, and then counting the occurrence of these words in the lyrics (Mayer et al., 2008).
TF-IDF was calculated for each preprocessed text in the training set, restricted to words between 3 and 12 characters in length. Words were also excluded if they appeared in fewer than 50 songs, or more than 50 per cent of songs. For each genre, the average TF-IDF values were calculated, creating an ordered list of words that are common to lyrics of that genre. The 50 highest-valued words for each genre were then taken to create bag-of-words features. It is important to note that all words were converted to lowercase and had punctuation removed such that, for example, ‘Jesus’ and ‘jesus’ are considered as the same word. These were binary features that indicated whether each word was present in a text. Due to several words being frequent in multiple genres, only 170 binary features were created.
Despite the overlap of words for genres, some genres did have unique words in their lists. The highest-ranked words in reggae included Jamaican or Rastafarian slang such as ‘jah’, ‘babylon’, and ‘natty’. Highly ranked words in religious songs included religious terms; the top three words were ‘god’, ‘lord’ and ‘jesus’. Hip hop saw many profane words rank highly, with five of the top six words being profane.
Profanity features were also constructed. These were the number of profane words, number of unique profane words, and the frequency of profane words in the lyrics. Profanity was detected using the Lewis profanity list (2014). Jewalikar and Fragapane (2015) found that the rate of profanity varies depending on the genre of music. Hip hop songs were the most profane, with one in every 47 words being a profanity, while genres such as folk and country were the least profane (one profanity in every 2925 and 4438 words, respectively). Powell-Morse (2014) found a similarly high rate of profanity in rap music, on average 13.76 instances of profanity per rap song. These findings suggest that profanity may be a useful characteristic with which to differentiate between genres.
Structural features
The structural features in this paper are: average line-syllable similarity, mean line-syllable length, deviation line-syllable length and similar verse count. Line-syllable length is calculated as the number of syllables that occur in a line, and the line-syllable similarity between any two lines can be calculated with Equation 1.
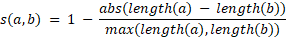
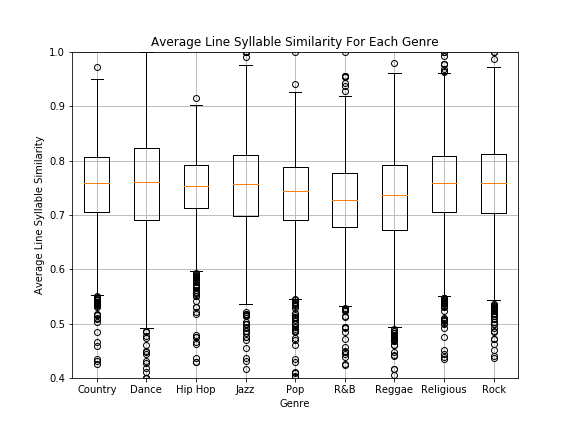
By using Equation 1, the average line-syllable similarity can be calculated as the mean similarity between all adjacent lines in the lyrics. A box plot of values for each genre is shown in Figure 3. For all genres, the mean value for lyrics falls between 0.7 and 0.8; however, the metric’s range is noticeably smaller for genres such as hip hop, pop and R&B.
Lyric classification
As we have generated a high number of features, we will use dimension reduction to improve computational efficiency. To reduce the dimensionality of the dataset, we performed principal components analysis (PCA) on the features calculated on the training set. PCA maps data with a high number of features into a lower dimensionality such that the variance of the lower dimensional representation of the data is maximised. The features were reduced to 30 dimensions.
We used the PCA features to train a range of machine-learning models: k-nearest neighbours (kNN), support vector machines (SVM), random forest classifiers, multi-layer perceptrons (MLP), Naïve Bayes and XGBoost classifiers. We performed five-fold stratified cross-validation (CV) alongside grid search to select the best hyperparameters for each model. The best performances of each model are shown in Table 2.
| Model | Best Performing Hyperparameters | CV Accuracy |
| SVM | C=1, gamma=‘scale’ | 0.53555 |
| XGBoost | learning_rate=0.3, max_depth=3, reg_lambda=0.5, subsample=0.75 | 0.51932 |
| Random Forest | n_estimators=200, max_depth=None, max_features=3 | 0.51220 |
| MLP | hidden_neurons=50, alpha=0.0001 | 0.50175 |
| kNN | n_neighbors=67 | 0.49031 |
| Naïve Bayes | N/A | 0.48739 |
For each model, the best performing hyperparameters were used to build a model that could predict genres in the evaluation set. Accuracies, between 0 and 1 inclusive, on the evaluation set are shown in Table 3.
| Model | Evaluation Accuracy |
| SVM | 0.56136 |
| MLP | 0.54830 |
| Random Forest | 0.54760 |
| XGBoost | 0.53360 |
| kNN | 0.52193 |
| Naïve Bayes | 0.49463 |
Discussion
The best performing model was the SVM, which had an accuracy of 0.56136. The accuracy of every model on the evaluation set was higher than the accuracy achieved by Mayer et al. The work of Mayer et al. would be expected to achieve a lower accuracy as it was performed on ten genres, compared to nine in our study, but the accuracy difference of 0.22666 between the studies is a major difference, suggesting improvement through this study. It would be beneficial to the task of lyric classification if a standard dataset were created to allow an easy comparison of models in the future, similar to that used for the recognition of handwritten digits (LeCun et al., 1998).
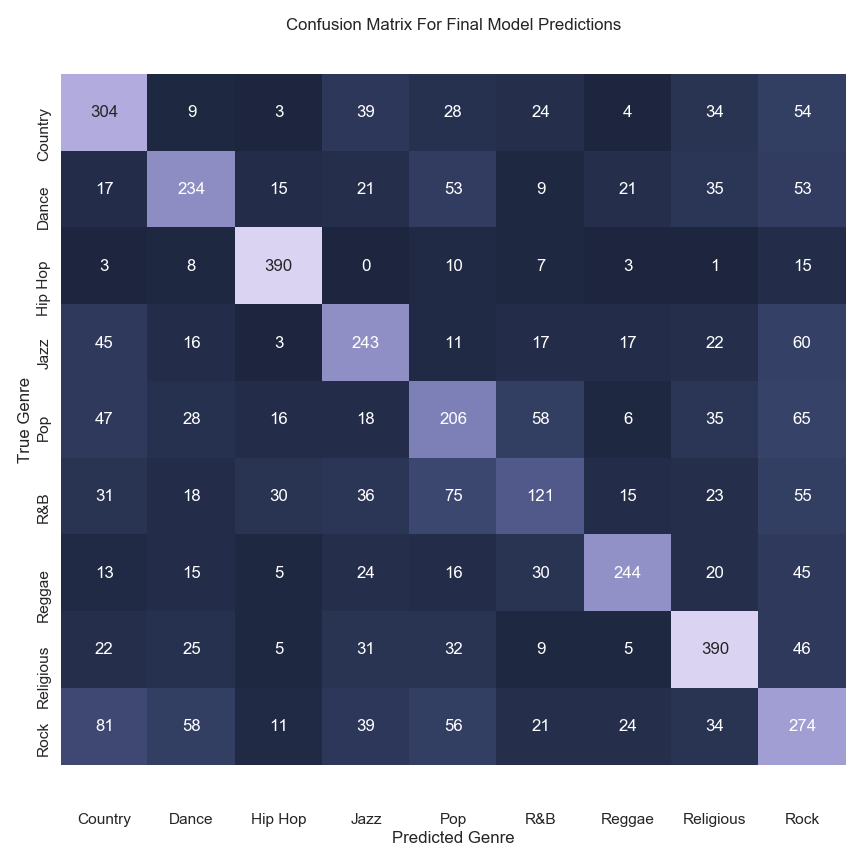
The confusion matrix for the SVM is shown in Figure 4. From the confusion matrix it is evident that the model performs best on hip hop lyrics, with an accuracy of 0.89245 for that genre. The model performs least well on R&B, pop and rock lyrics with accuracies of 0.29950, 0.43006 and 0.45819 for the respective genres. These three genres are hard to differentiate for the model, with 130 R&B lyrics being classified as either pop or rock, more than the number of R&B lyrics that were correctly classified. Rock is a common incorrect prediction for lyrics of most genres.
Due to the ratio of songs per artist, and the training and evaluation datasets containing the same artists, we recognise that the models may be overfitting to certain styles of the artists as opposed to whole genres. The large number of musical artists that we used in this study reduces the overfitting; however, it could further be reduced in future studies by introducing artists in the evaluation stage that were not seen by the models in the training stage. By including this step, the diversity of the dataset for each genre would increase, therefore giving an advantage to models that better generalise when comparing the different models.
The feature importance for two models created in this paper can be seen in Figure 5 – however, since the models were fit using the PCA components, the importances are in terms of these components. The most important components across these two models based upon average importance are components 0, 4, 2, 8 and 3 respectively.
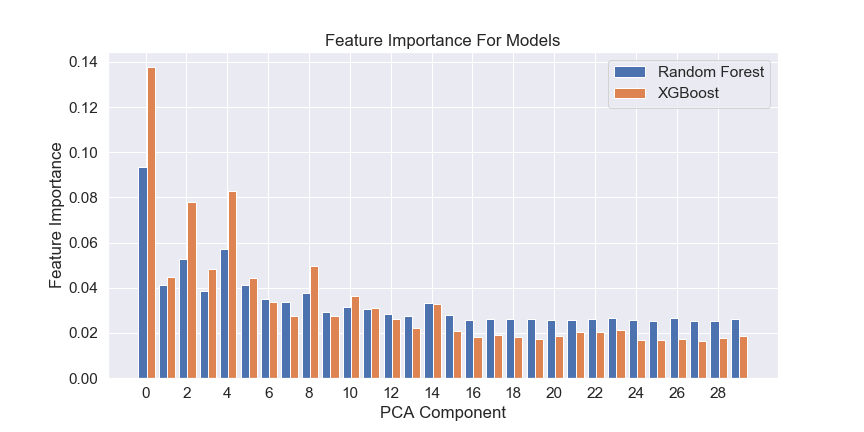
By transforming a diagonal matrix through the PCA function, it is possible to see the influence each original feature has on the PCA components. The highest influencing features on component 0 are total words, characters and letters – all features that define the length of the lyrics. Therefore, these features could be seen as the most important when differentiating between genres.
Components 2 and 4 are both influenced greatly by features relating to the vocabulary of religious and reggae lyrics, respectively. Component 8 is also influenced greatly by vocabulary features; however, it is not specific to one genre. Therefore, vocabulary features could also be viewed as important when differentiating between genres.
Due to the implementation of the SVM model in the scikit-learn Python package, the feature importance for the highest performing model could not be obtained. However, the high feature importance correlation for other models suggests that the feature importance for the SVM will be similar. In future research, it may be beneficial to use methods to understand the workings of the SVM, such as Local Interpretable Model-agnostic Explanations (LIME) (Ribeiro et al., 2016).
Another avenue for future work is the use of deep-learning approaches for multi-class classification. Deep-learning models have been shown to outperform classical machine-learning models in a variety of different prediction tasks (Nguyen et al., 2018; Paterakis et al., 2017). Natural-language processing (NLP) transformers, such as RoBERTa developed by Facebook, may be particularly suited to tasks such as music-genre classification from lyrics due to the textual nature of the problem.
Conclusion
A total of 21,416 song lyrics were collected across nine different genres of music: hip hop, R&B, rock, pop, country, dance, religious, jazz and reggae. These lyrics were split into a training set and evaluation set using an 80/20 split for the purpose of building models for the classification of lyrics by music genre.
A total of 217 features were engineered across four abstract categories: textual statistics, syllabic and rhyming features, vocabulary, and structural features. Principal components analysis was then performed on the dataset and used to build several different models. The best performing model was a SVM, with an accuracy of 0.56136 across the nine genres. This accuracy was highest when predicting on hip hop lyrics, with an accuracy of 0.89245, and lowest on R&B lyrics, with an accuracy of 0.29950. The overall accuracy of the SVM model was greater than the accuracies of similar models in existing literature.
Due to the implementation of SVMs in the popular scikit-learn Python package, the importance of features cannot be obtained trivially. Instead, the feature importance for random forest and XGBoost models was used to find the most important features. It was concluded that features correlating with the length of the lyrics, as well as features related to vocabulary, were the most important features in this task. Further studies may wish to expand upon the analysis of the importance of individual features.
List of figures
Figure 1: Mean textual statistic metrics across the nine genres.
Figure 2: Flesch reading ease box plots for each genre, measuring the readability of lyrics.
Figure 3: Average line-syllable similarity for each genre.
Figure 4: True and predicted counts for each genre.
Figure 5: Feature importance for random forest and XGBoost models.
List of tables
Table 1: Genre distribution of the dataset and training set.
Table 2: Cross-validation accuracy of models with their best performing hyperparameters.
Table 3: Accuracy of models on the evaluation set.
References
Bahuleyan, M. (2018), ‘Music genre classification using machine learning techniques’, available at https://arxiv.org/abs/1804.01149, accessed 19 December 2019
Edwards, P. (2009), How to Rap: The Art and Science of the Hip-Hop MC, Chicago: Chicago Press Review, pp. 193–95
Fell, M. and C. Sporleder (2014), ‘Lyrics-based analysis and classification of music’, COLING 2014, the 25th International Conference on Computational Linguistics, Dublin, 23–29 August 2014
Flesch, R. (1948), ‘A new readability yardstick’, Journal of Applied Psychology, 32 (3), 221–33
Jewalikar, V. and F. Fragapane (2015), ‘Hip hop lyrics are the most profane’, available at https://lab.musixmatch.com/profanity_genres/, accessed 10 December 2019
KOOP (2019), ‘Music genres & definitions’, available at https://koop.org/shows/genres-definitions/, accessed 1 December 2019
LeCun, Y., L. Bottou, Y. Bengio and P. Haffner (1998), ‘Gradient-based learning applied to document recognition’, Proceedings of the IEEE, 86, 2278–324
Lewis, R. (2014), ‘Naughty word list, complied by Google and @jamiew’, available at https://gist.github.com/ryanlewis/a37739d710ccdb4b406d, accessed 10 December 2019
Malmi, E., P. Takala, H. Toivonen, T. Raiko and A. Gionis (2016), ‘DopeLearning: A computational approach to rap lyrics generation’, in KDD ’16, Proceedings of the 22nd ACM SIGKDD International Conference on Knowledge Discovery and Data Mining, 2016, San Francisco: ACM, pp. 195–204
Mayer, R., R. Neumayer and A. Reuber (2008), ‘Rhyme and style features for musical genre classification by song lyrics’, in Proceedings of the 9th International Conference on Music Information Retrieval, 2008, Philadelphia: ISMIR, pp. 337–42
Nielsen Music (2019), ‘Nielsen music mid-year report U.S. 2019’, available at https://www.nielsen.com/wp-content/uploads/sites/3/2019/06/nielsen-us-music-mid-year-report-2019.pdf, accessed 1 November 2019
Nguyen, P. X. V., T. T. T. Hong, K. V. Nguyen and N. L. Nguyen (2018), ‘Deep learning versus traditional classifiers on Vietnamese students’ feedback corpus’, 5th NAFOSTED Conference on Information and Computer Science (NICS), pp. 75-80
Paterakis, N. G., E. Mocanu, M. Gibescu, B. Stappers and W. van Alst (2017), ‘Deep learning versus traditional machine learning methods for aggregated energy demand prediction’, 2017 IEEE PES Innovative Smart Grid Technologies Conference Europe (ISGT-Europe), pp. 1–6
Powell-Morse, A. (2014), ‘The best f*cking article you’ll read today: Profanity in rap lyrics since 1985’, available at https://web.archive.org/web/20140404121214/https://www.besttickets.com/blog/rap-profanity/, accessed 10 December 2019
Ribeiro, M. T., S. Singh and C. Guestrin (2016), ‘“Why should I trust you?” Explaining the predictions of any classifier’, available at https://arxiv.org/pdf/1602.04938v1.pdf, accessed 20 December 2019
Rodgers, K. (2020), ‘Since when was “escape room” a genre?’, available at https://www.papermag.com/spotify-wrapped-music-genres-escape-room-2649122474.html, accessed 01 October 2021
Silla Jr. C. N., A. L. Koerich and C. A. A. Kaestner (2008), ‘A machine learning approach to automatic music genre classification’, Journal of the Brazilian Computer Society, 10, 7–18
Tzanetakis, G. and P. Cook (2002), ‘Musical genre classification of audio signals’, IEEE Transactions on Speech and Audio Processing, 10 (5), 293–302
Zhang, W., W. Lei, X. Xu and X. Xing (2016), ‘Improved music genre classification with convolutional neural networks’, Interspeech 2016, 3304–08, doi: 10.21437/Interspeech.2016-1236
Glossary
Cross-validation: Training a model over multiple iterations, where each iteration uses a different portion of the dataset for training and testing.
Feature: A measurable property of the data.
Flesch Reading Ease: A quantified measure of readability.
Hand-crafted features: Intuitive features calculated via an equation or simple algorithm, as opposed to inferred features from a deep-learning model.
Principal Components Analysis (PCA): A method to change the dimensionality of data by calculating the principal components of the data.
Readability: How difficult a text is to understand in English.
Rhyme density function: A function that quantifies the frequency of rhymes in lyrics.
Support Vector Machine (SVM): A machine-learning model that separates data into different classes using hyperplanes.
To cite this paper please use the following details: Thompson, C. (2021), 'Lyric-Based Classification of Music Genres Using Hand-Crafted Features', Reinvention: an International Journal of Undergraduate Research, Volume 14, Issue 2, https://reinventionjournal.org/article/view/705. Date accessed [insert date]. If you cite this article or use it in any teaching or other related activities please let us know by e-mailing us at Reinventionjournal@warwick.ac.uk.