
Yuto Nohdomi, Carleton College
Drawing on Thomas Schelling’s 1971 dynamic model of racial segregation, this paper re-examines the model by introducing economic constraints that reflect modern limitations on wealth-driven sorting. Although Schelling’s model effectively introduces segregation patterns influenced by social preference, it fails to account for real-world housing market patterns driven by financial mobility. To address this limitation, the standard model was modified to mimic a city’s housing market where property values decrease as one moves further from the city centre. Two simulated groups (referred to as agents, representing individual households) were assigned varying degrees of income disparity, introducing a new agent state termed ‘trapped’, in which the agent’s desire to relocate based on social preference is inhibited by a lack of purchasing power. After running 2000 simulations across a control group and three economic disparity levels (low, medium and high) with varying social preference thresholds, the results reveal three key findings: (1) Income disparity drove spatial economic sorting, (2) interestingly, increased income disparity reduced overall social segregation by inhibiting feedback loops based on social preference, and (3) high-income disparity led to housing market friction, which made 12 per cent of agents ‘trapped’. Ultimately, these findings suggest that economic disparity successfully influences segregation patterns and, crucially, incorporates financial constraints into urban sociological models.
Keywords: Residential segregation, economic disparity, agent-based modelling, urban sociology, housing market
Racial segregation has been observed in many regions of the world, from the Apartheid segregation in South Africa and caste-based exclusion in India to systematic segregation against Indigenous peoples in Australia. As one of the most durable and damaging features of modern society, segregation has proven to be a fundamentally persistent global phenomenon (Menendian et al., 2021).
Nobel Laureate Thomas Schelling presented the principal explanation for segregation patterns in his seminal 1971 paper, Dynamic Models of Segregation. Schelling introduced a simple agent-based model that explores how macrobehaviour in racial segregation arises through individual preferences for neighbours (Schelling, 1971). In his model, two types of agents (‘blue’ and ‘orange’) are on a grid. Each agent has a single movement preference defined by a ‘%-similar-wanted’ threshold, which represents a desire to live in a neighbourhood where a certain percentage of its neighbours share the same colour (Schelling, 1971). If an agent finds that the proportion of agents with the same colour in its surroundings is less than the threshold, it becomes ‘unhappy’ and moves to a random empty spot (Google, 2025). Schelling hypothesised threshold to be 50 percent.
Schelling’s findings highlighted a ‘tipping point’. He discovered that after a certain threshold, segregation can emerge even when agents possess only a mild preference for living with their own colour (Schelling, 1971). This critical tolerance threshold was found to be ≈ 33 percent. For any tolerance threshold below this value, a random pattern of agents was to be found. Above this value, agents converge into a fully segregated state. These two findings became the central focus of the model, as the ‘tipping point’ value was well below the hypothesised threshold, and values near the critical threshold did not yield stable, mild segregation patterns, and instead generated an abrupt transition from mixed to fully segregated neighbourhoods (Schelling, 1971).
Although the model clearly depicts the emergence of segregation through social preferences, it does not account for economic constraints that determine where agents can move. Consequently, Schelling’s model holds more theoretical importance than it does in producing practical residential segregation patterns, as it does not account for the real-world housing market.
Residential segregation is largely influenced by racial disparities in wealth, which have increased in the United States since the 1980s due to globalisation, deindustrialisation, and economic liberalisation (Williams and Collins, 2001). Comparatively, when Schelling’s paper was published in 1971, disparity gaps, although still significant, were much less pronounced than those observed in present-day American society (Perry et al., 2024). Schelling’s model, which assumes residential segregation is merely the result of social preferences, has limited its ability to produce segregation patterns that reflect modern society. As these income gaps continue to grow, it is analytically insufficient to assume modern-day segregation is solely a result of preferences. Currently, where individuals and families live is determined by financial constraints, which reinforce spatial divisions between groups, with affluent neighbourhoods having a greater concentration of higher-quality schools, parks, and other amenities (Tammaru et al., 2019). Furthermore, studies suggest that affluent and low-income households are less likely to live next to each other, and the number of mixed-income neighbourhoods has decreased. In large to moderate-sized metropolitan areas, the share of families living in middle-income neighbourhoods has decreased from 65 per cent to 45 per cent since 1970, while the emergence of affluent and poor neighbourhoods has doubled (Reardon and Bischoff, 2011).
Additionally, a study led by Mark Fossett and Warren Waren, both professors at Texas A&M University, suggests a strong relationship between economic status and ethnicity. Fossett created a model that considered three residential groups to reflect the housing environment of the United States (White, Black and Hispanic), which differ in economic status. Fossett’s final conclusion found that a ‘reduction in housing discrimination by race may not necessarily lead to large declines in ethnic segregation’, if root economic disparities are not addressed (Fossett and Waren, 2005: 185). Given these potential disparities, how might the relationship of economic constraints and social preferences shape housing segregation patterns in urban areas?
In lieu of relying on Schelling’s model assumption, it is necessary to adapt the model from a theoretical simulation to a practical model to accurately reflect modern segregation patterns. This modification bridges this gap by introducing a crucial variable that Schelling’s model omits: economic constraints. To explore how segregation patterns are influenced by what each agent can afford, I further modified the model’s principal logic to mimic an urban housing market.
First, I assigned property values based on a gradient anchored in the centre of the grid, which represents an area within a city. This configuration mimics a city centre where locations on the map (referred to as ‘patches’ in NetLogo, which was used for this simulation) in the centre are more expensive, and those farther from the centre are cheaper (see Appendix 1). Second, each agent type can be assigned mean income levels based on their colour (higher-income ‘blue’ group and lower-income ‘orange’ group). To establish a baseline, density (90 per cent), base income (90 per cent), and income standard deviation (9) were fixed. The income disparity is controlled by the ‘disparity-gap’ slider (the NetLogo term for a user-adjustable setting in the simulation that increases or decreases the wealth gap between the two groups). Increasing the slider increases the mean income of blue agents while concurrently reducing the mean income of orange agents. Specifically, the model compared a control group (disparity-gap = 0) to three experimental groups with disparity gaps of 10, 20, and 30 simulating (1) low disparity (mean incomes of 100 v 80, representing a 20-point income different from the base income), (2) medium disparity (mean incomes of 110 v 70, representing a 40-point difference), and (3) high disparity (mean incomes of 120 v 60, representing a 60-point difference).
Additionally, to simulate salaries and maintain model dynamics, each agent receives periodic payments after a predetermined number of time steps (referred to as ‘ticks’ in NetLogo). Third, a new movement pattern emerges due to affordability constraints, in which unhappy agents can only move to unoccupied patches they can afford (i.e., the agent’s wealth is greater than or equal to the patch’s price). Introducing this movement rule allows for a new agent state (‘trapped’) in which an agent is unhappy because the similarity is below the ‘%-similar-wanted’ threshold but is unable to relocate because it cannot afford any patches around it. This allows exploration of what proportion of the population (percent-trapped) is financially constrained from relocating.
This new agent state is critical to simulate the real-world complexities that Schelling’s model fails to address. For instance, research regarding the cities of Yaffo and Ramle suggests that ‘low-income Jews and Arabs may not be able to avoid living together, while the richer Jews and Arabs are able to segregate…’ (Hatna and Benenson, 2012, Section 1.10). This modified model accounts for such nuances, as the introduced ‘percent-trapped’ monitor directly measures the inability to avoid living together, and the ‘avg-dist-blue’ (tracking the average distance of higher-income agents from the city centre) and ‘avg-dist-orange’(tracking the average distance of lower-income agents from the city centre) monitors can record whether ‘wealthier’ agents are in fact increasingly segregated in more desirable locations.
Considering the modifications, I expected the model’s behaviour to change in many ways. First, I hypothesised that the model would produce a new pattern of residential segregation – economic segregation – which better reflects patterns in urban areas. Higher-income agents (blue) would leverage their higher income to occupy more expensive, desirable patches near the centre. In contrast, lower-income agents (orange) would be displaced and forced into peripheral areas of lower desirability and patch price. This assumption was based on real-world parallels, as Turner and Greene note that ‘people of colour are overrepresented in neighbourhoods with high poverty rates, where essential resources like quality schools, full-service grocery stores, safe and healthy parks, and reliable transportation are often lacking’ (Turner and Greene, 2021). The modified model attempts to simulate this by symbolically assigning amenity-rich patches based on their proximity to the centre, with wealth acting as a barrier to entry.
Second, I hypothesised that economic disparity would drive increased rates of residential segregation. Research has supported the theory that income inequality only translates effectively into segregation to enforce residential sorting. Ann Owens (2019) found that the interplay between the two is ‘as large as or larger’ than the direct relationship between income segregation and income inequality, therefore proving its significance in perpetuating residential segregation. I speculated that income would become a new driver of social segregation, with the higher-income group (blue) occupying higher-priced areas and accelerating their movement as it becomes easier to buy into ‘exclusive neighbourhoods’. Simultaneously, the lower-income group (orange) would be immediately limited to a fixed number of affordable areas and clusters near the city’s outskirts.
Third, I hypothesised the control group (disparity-gap = 0) would have no agents trapped, as all agents have equal purchasing power and ability to relocate. Conversely, as the income disparity increased, the ‘percent-trapped’ would increase. As income disparity increases, there will be a threshold at which higher-income agents can afford any patch, while lower-income agents remain continuously restricted by their purchasing power.
To test and isolate the effects of the implemented modifications, I designed a formal experiment using the BehaviourSpace. To establish a baseline that reflects the model’s original behaviour, I set up a control group in which the ‘disparity-gap’ was set to 0 across the subcategories for each experiment condition, thereby giving both agent types equal purchasing power. Subsequently, the control condition was compared to three experimental groups with varying levels of ‘disparity-gap’ of 10, 20 and 30. For all experimental conditions, the variable for social preference, ‘%-similar-wanted’, varied from 40 per cent to 80 per cent in increments of 10 per cent. All other parameters and variables were kept constant to better present the effects of the modification. Density (90 per cent), base income (90 per cent), and income standard deviation (9) were fixed. To ensure the reliability and validity of the experiment’s results, each experimental condition combination was repeated ten times, yielding a total of 2000 simulation runs. Consequently, the data presented in the following sections refer to the average outcome of these ten repetitions for each condition. The experiment primarily measured the effects of income disparity on (1) social segregation – how clustered agents are, recording the final ‘percent-similar’ to assess agents’ similarity to neighbours, and (2) economic segregation – how income differences change where agents live, recording the final ‘avg-dist-blue’ and ‘avg-dist-orange’ to assess agent types and their average distance from the city centre. Finally, the newly introduced agent’s state (trapped?) was measured using the ‘percent-trapped’ variable to assess the role of financial strain in residential mobility.
Each experiment yielded conclusive results, validating two of the three hypothesised outcomes and, most notably, challenged the expectation that increased income disparity would lead to higher levels of residential segregation. All data visualised in Figures 1, 2, and 3 (see Appendices 1, 2 and 3 below) depict a clear narrative of how economic constraints fundamentally change Schelling’s original segregation patterns.
First, my initial hypothesis that the model would produce new patterns of residential segregation – specifically economic segregation that most commonly occurs in urban areas – was validated through the experiment data. Figure 2 (see Appendix 2 below) illustrates the average distance for each type of agent from the city centre across varying levels of social preference. Regardless of agents’ social preference thresholds, the control group (disparity-gap = 0), although fluctuating between 14.0 and 14.1 units, consistently had nearly identical average distances for both agents, indicative of a random spatial distribution relative to the city centre, in the absence of economic constraints. Contrastingly, the high disparity gap (30) led to a sharp division in spatial distance between the two agent types. The higher-income agents (yellow line) clustered near the more expensive city centre, with their average distance dropping to approximately 12.6 units. On the other hand, the lower-income agents (green line) were displaced to the city’s outskirts, and their average distance increased to approximately 15.5 units. The nearly three-unit difference in spatial location suggests that income disparity is an effective mechanism for residential sorting. The higher-priced patches are immediately unattainable, leaving the ‘desirable’ city centre for wealthier agents, while lower-income agents, independent of social preferences, are displaced to peripheral locations.
Second, my hypothesis that economic disparity would increase social segregation was proven incorrect. As Figure 1 (see Appendix 1 below) illustrates that income disparity and social segregation exhibit an inverse relationship that is counterintuitive. The control group (disparity-gap = 0), which reflects Schelling’s original model, consistently recorded the highest levels of segregation across all social preference thresholds. At its highest, absolute segregation was 98.7 per cent as social preference increased to 80 per cent. However, as income disparity is introduced, the final recorded segregation is, interestingly, reduced. The green line, representing the highest level of income disparity (disparity-gap = 30), consistently appears at the lowest point on the graph, with other levels of disparity following in sequence. This effect is most evident as the agents are relatively tolerant, more specifically where 40 per cent similarity with neighbours is desired. In this scenario, the control group achieves 85.4 per cent segregation, while the high-disparity group achieves only 75.8 per cent. Accordingly, the findings from this experimental condition provide new insight into the relationship between income disparity and segregation. Falsifying my hypothesis, the data suggests that agents’ financial constraints inhibit the social-preference feedback loops that drive segregation in Schelling’s original model. When the wealth gap is high, individuals are priced out of their preferred neighbourhoods, overriding their social preferences and trapping them in mixed but less desirable locations.
Third, my hypothesis that economic disparity would cause residential immobility was confirmed. As depicted in Figure 3 (Appendix 3), the control group (disparity-gap = 0) showed no trapped agents across all social preference thresholds. This suggests that, without financial constraints, all agents have full access to the housing market. The results of the experiment suggest a positive relationship between income disparity and the percentage of trapped agents. The low-disparity group showed a maximum of approximately 2.5 per cent of trapped agents, while the high-disparity group showed a significantly higher rate of 12 per cent. More interestingly, the divergent trajectory observed as social preference thresholds increases suggests that their effects compound. In other words, as the desire for higher social preference increases, the lower-income group becomes increasingly locked out of the housing market. This pattern bears some conceptual resemblance to the ‘secular decline’ Frost describes in residential mobility rates, which fell from approximately 20 per cent in the 1980s to 10 per cent in 2019 (Frost, 2020). In the model, trapped agents are unable to participate fully in residential turnover because affordability constraints restrict their movement options. Removing 12 per cent of the population from the normal course of home turnover creates disparity creates spatial disparity, and leaves the most vulnerable agents excluded from the benefits of mobility.
Introducing economic constraints into Schelling’s model revealed how financial factors influence residential segregation. The most critical finding of my modified model depicts a counterintuitive segregation pattern as income disparity increases. In Schelling’s original model, the mechanisms that create clusters of each type of agent are social preferences (%-similar-wanted). However, as agents’ income disparity increases, their social preferences are eclipsed, thus creating segregation patterns that are more mixed, due to the higher rates of ‘trapped’ agents who are immobile and getting in the way of the original model’s sorting pattern.
To further explore the implications of this model, a ‘desirability’ feature could be added, where the cost of each patch determines its quality, thereby exploring mechanisms of gentrification. Currently, higher-income agents are primarily incentivised by both social preference (%-similar-wanted) and their ability to outbid lower-income agents for central patches. Ultimately, this would transform the simulation from a reactive model to a more dynamic one, raising the question for future research: if agents prioritise amenity-rich areas near the centre, would the results be distinct or indistinguishable from those of the already modified model, in which income disparity led to lower rates of segregation?
As such, beyond theoretical modelling, these findings suggest that housing segregation is as much an economic issue as a social one. Looking ahead, policies that address only social integration may be insufficient if they do not also address the economic barriers that shape residential mobility. To nurture economic mobility and protect vulnerable populations, policies must shift toward economic interventions such as equitable wealth distribution, affordable housing mandates and more.
Lighter patches represent higher-priced areas near the city centre and darker patches in the outskirts represent more affordable areas.
Figure 1. NetLogo grid displaying the property value gradient
Final recorded percentage of similar neighbours (percent-similar) with varying levels of economic disparity. This figure shows that economic disparity limits the extent of social segregation among agents.
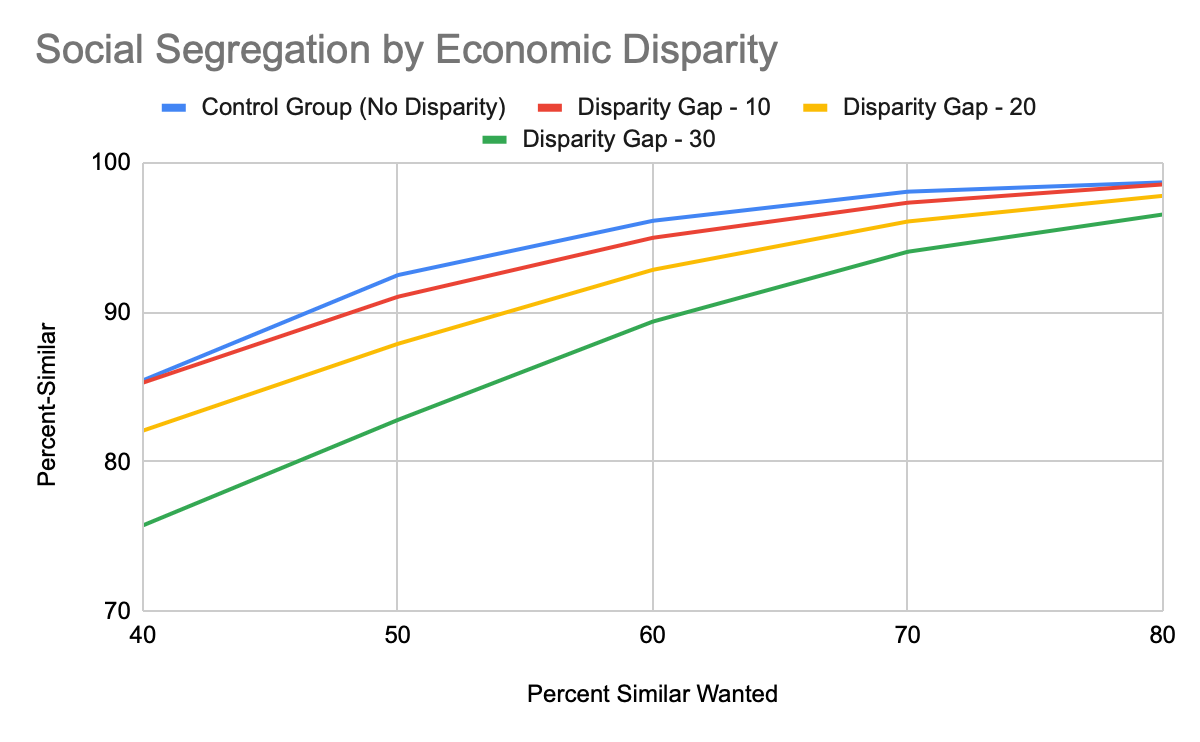
Figure 2. Social segregation by economic disparity
Final recorded percentage of agents unable to relocate (percent-trapped) at varying levels of economic disparity. This figure highlights that higher rates of disparity increase the percentage of agents who are unable to relocate
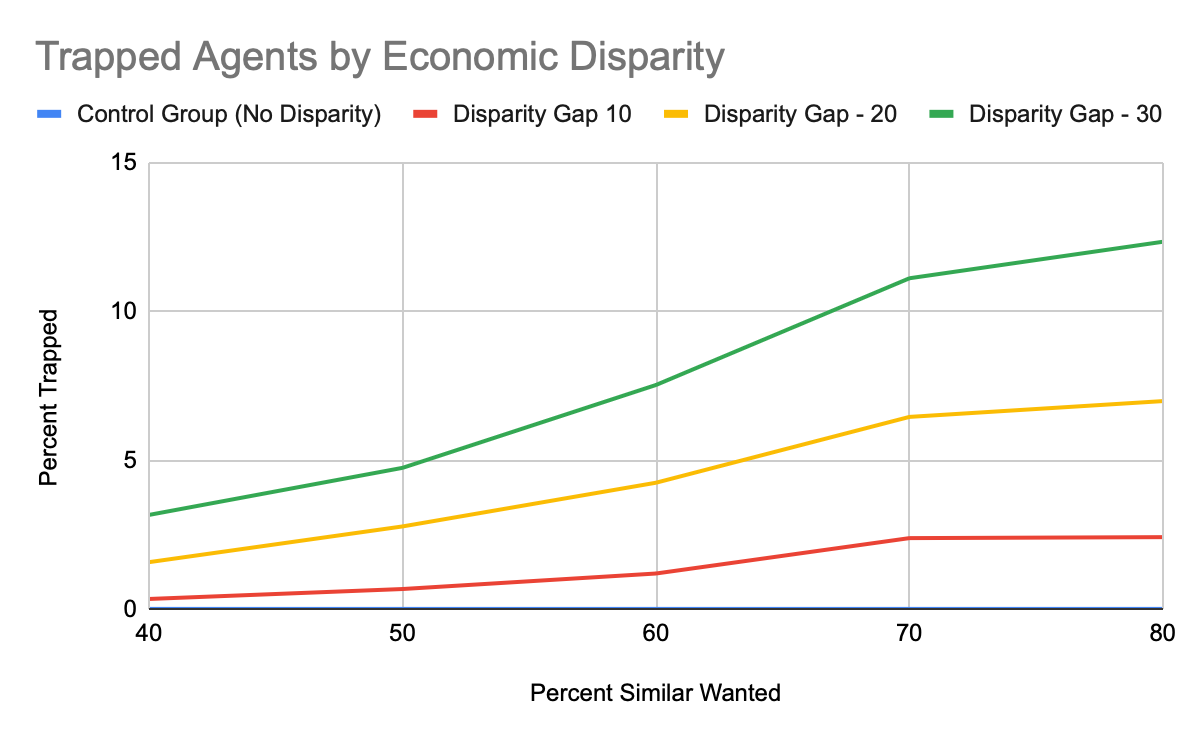
Figure 3. Percentage of trapped agents by economic disparity
Final recorded distance of blue and orange agents from the grid centre with varying levels of economic disparity and social preference. This figure highlights that higher-income agents cluster to the centre as economic disparity increases.
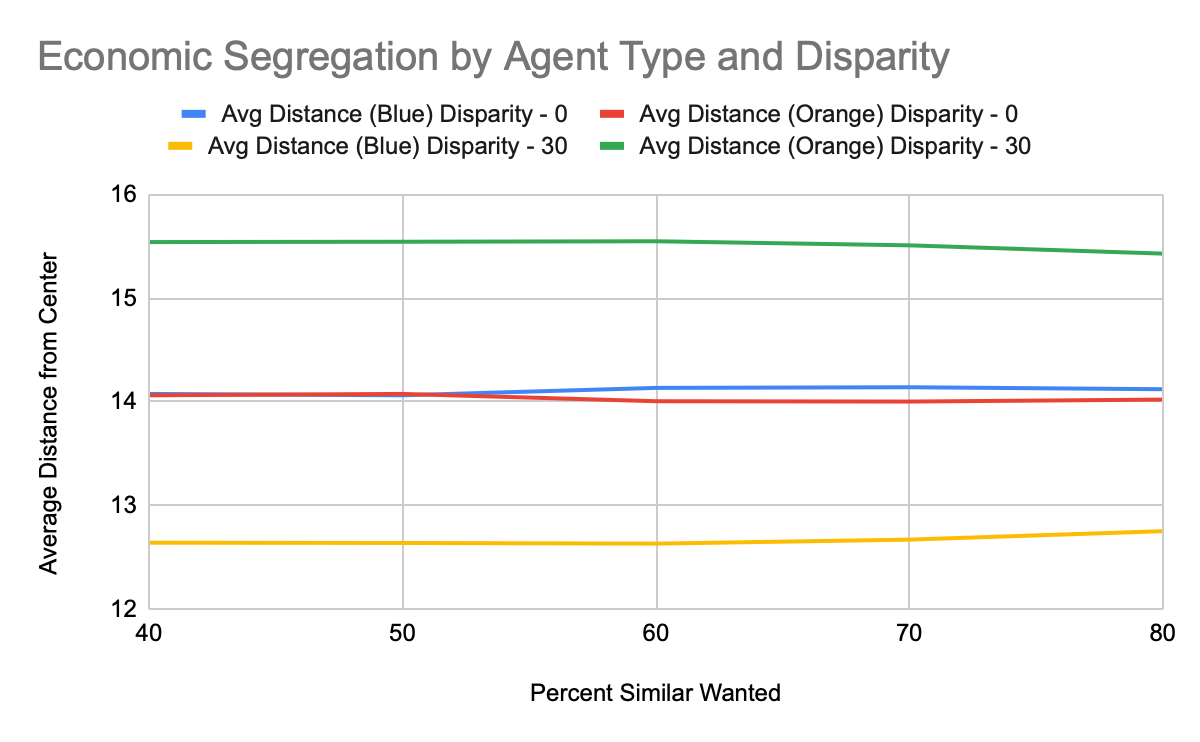
Figure 4. Average distance from centre by agent type and economic disparity
The full agent-based simulation is accessible constructed for this paper is accessible on any standard web browser without installation at the link provided:
https://schelling-disparity-model.netlify.app
I used Google Gemini in a supportive way in writing this paper. Primarily, I used it to explain how Thomas Schelling’s Segregation model works and to provide general background on segregation. Further, I used it for preliminary background research and to better understand concepts. I also used it to refine my wording and syntax to better reflect what I intended to say. Beyond this, everything is my own work.
Fossett, M. and W. Waren (2005), ‘Overlooked implications of ethnic preferences for residential segregation in agent-based models’, Urban Studies, 42 (11), 1893–1917, https://doi.org/10.1080/00420980500280354 accessed 20 November 2025.
Frost, R. (2020), Are Americans Stuck in Place? Declining Residential Mobility in the US, Joint Center for Housing Studies of Harvard University, available at https://www.jchs.harvard.edu/sites/default/files/harvard_jchs_are_americans_stuck_in_place_frost_2020.pdf accessed 18 November 2025.
Google (2025), ‘Gemini’, Gemini.google.com, available at gemini.google.com/app accessed 15 November 2025
Hatna, E. and I. Benenson (2010), ‘The Schelling model of ethnic residential dynamics: Beyond the integrated - segregated dichotomy of patterns’, Journal of Artificial Societies and Social Simulation, 15 (1), 6, available at www.jasss.org/15/1/6.html accessed 14 November 2025.
Menendian, S. et al. (2021), ‘The roots of structural racism project’, Othering & Belonging Institute, available at belonging.berkeley.edu/roots-structural-racism accessed 15 November 2025.
Owens, A. (2019), ‘Building inequality: Housing segregation and income segregation’, Sociological Science, 6, 497–525, https://doi.org/10.15195/v6.a19 accessed 17 November 2025
Perry, A. M., et al. (2024), ‘Black wealth is increasing, but so is the racial wealth gap’, Brookings, available at www.brookings.edu/articles/black-wealth-is-increasing-but-so-is-the-racial-wealth-gap/, accessed 16 November 2025.
Reardon, S. F. and K. Bischoff (2011), ‘More unequal and more separate: Growth in the residential segregation of families by income, 1970–2009’, US2010 Project, available at cepa.stanford.edu/content/more-unequal-and-more-separate-growth-residential-segregation-families-income-1970-2009, accessed 14 November 2025.
Schelling, T. C. (1971), ‘Dynamic models of segregation’ The Journal of Mathematical Sociology, 1 (2), 143–86, https://doi.org/10.1080/0022250x.1971.9989794, accessed 24 October 2025.
Tammaru, T. et al. (2019), ‘Relationship between income inequality and residential segregation of socioeconomic groups’, Regional Studies, 54 (4), 450–61, https://doi.org/10.1080/00343404.2018.1540035, accessed 17 November 2025.
Turner, M. A. and S. Greene (2021), ‘Causes and consequences of separate and unequal neighborhoods’, Urban Institute, available at www.urban.org/racial-equity-analytics-lab/structural-racism-explainer-collection/causes-and-consequences-separate-and-unequal-neighborhoods, accessed 25 November 2025.
Williams, D. and C. Collins (2001), ‘Racial residential segregation: A fundamental cause of racial disparities in health’, Nih.gov, available at pmc.ncbi.nlm.nih.gov/articles/instance/1497358/pdf/12042604.pdf, accessed 16 November 2025.
Agent: An individual entity in a model (more specifically a household or person) given a specific colour attribute, income level and movement preference.
Patch: An individual cell within the Netlogo grid representing a specific geographic location or household.
Tick: A unit of time or step in the simulation process.
BehaviourSpace: A tool that automates experiments based on user-defined parameters and streamlines data export.
%-similar-wanted: An agent’s threshold preference representing the minimum percentage of neighbouring agents to share the same colour for the agent to feel satisfied.
avg-dist-blue: Simulation monitors tracking the average distance of the distance of each respective agent colour from the city centre:
avg-dist-orange: Simulation monitors tracking the average distance of the distance of each respective agent colour from the city centre.
To cite this paper please use the following details: Nohdomi, Y. (2026), 'Introducing Economic Disparity and Housing Immobility to Schelling’s Dynamic Model of Segregation', Reinvention: an International Journal of Undergraduate Research, Volume 19, Issue 2, https://reinventionjournal.org/index.php/reinvention/article/view/2629. Date accessed [insert date]. If you cite this article or use it in any teaching or other related activities, please let us know by emailing us at Reinventionjournal@warwick.ac.uk.
https://doi.org/10.31273/reinvention.v19i2.2629, ISSN 1755-7429 © 2026, contact reinventionjournal@warwick.ac.uk. Published by Warwick Education Academy, University of Warwick. This is an open access article under the CC-BY licence (https://creativecommons.org/licenses/by/4.0/)