Daniella R. Gullotta, David Prego and Yibeltal F. Alem, University of Canberra
Near-field communication (NFC) is widely used in access control systems such as payment processing and regulating access to facilities. Due to its decentralised nature, NFC is constrained by resource limitations, making it vulnerable to exploits such as key cloning. This study investigated the effectiveness of machine-learning algorithms in visually distinguishing cards as an added security measure against unauthorised cloned cards.
The methodology includes collecting datasets, building classification models (CNN, KNN and SVM), performance evaluations and integration of the best-performing model into an NFC prototype, Clone Guard. Performance evaluations included accuracy, precision, F1-score and recall metrics. We found that CNN was the best-performing model, with a prediction accuracy of 96 per cent.
Experimental results showed that noisy datasets produced a more robust model than noiseless datasets. Heatmap visualisations indicate that distinct colours and bold text regions contributed significantly to the model’s decision-making. Despite the high accuracy on test data, the prototype performed less accurately when classifying scanned cards.
The study provided a basic evaluation of classification algorithms, concluding that deep learning offered greater suitability. The implications of the prototype extended into the applied research domain, offering a configurable and deployable solution to improve the resilience of NFC-based access systems against unauthorised cloned cards.
Keywords: Near-field communication-based access systems, clone card detection, visual authentication using machine learning, deep learning (CNN) for NFC security, Image-based card verification.
Near-Field Communication (NFC) is a wireless technology that facilitates communication between devices over short distances. NFC technology is widely ingrained in our day-to-day life primarily due to its ease of use, simplicity and various use cases such as in smart posters, e-payments and facility access control systems.
However, despite its versatile applications, NFC technology imposes various resource and storage constraints, leaving it susceptible to security exploits, including key cloning (Lee et al., 2021; Singh et al., 2018). Furthermore, the emergence of hacktivist devices like the Flipper Zero has simplified the card-cloning process, making it widely available to anyone regardless of technical skill set (Flipper Devices Inc., 2024). Considering the context of access control systems, cloning valid access cards is both a cyber and physical security concern as it provides unauthorised access to physical facilities, generally unbeknown to the victim or security personnel. For corporate businesses and other industries that rely on secure access control, unauthorised access to their physical assets presents a range of privacy and financial implications (Bernard, 2017).
Recognising this as a contemporary security challenge, this paper explores two key research questions:
The remainder of this paper is organised as follows: in the Literature Review, we summarise related work to establish the academic context. The Methodology section outlines our approach, including the testbed setup and system design. We then present quantitative comparisons, supported by qualitative analysis of model and system performance in the Results section. Finally, we provide a summary of the paper’s key contributions and conclude the paper by suggesting directions for future research in the Conclusion section.
Despite the progression of technology, persistent NFC security vulnerabilities such as relay attacks, data corruption, eavesdropping, denial of service and cloning remain the focal point of contemporary research (Singh et al., 2018). Countermeasures do exist and predominantly fall within two categories: protocol authentication, data analysis or both (Lee et al., 2021; Yang et al., 2023; Yang et al., 2024). Authentication approaches dominate much of the current literature and are generally applied in the context of NFC-enabled smart devices. For instance, focusing on a university context, Bouazzouni et al. (2016) propose an access control architecture using Identity-Based Encryption and Trusted Execution Environments to verify the authenticity of both the user and the NFC reader. A similar implementation is explored by Ali Khan et al. (2020), where the authors propose a mobile application that requires users to verify a code sent via SMS after scanning an NFC tag before accessing a physical facility. By focusing on smart devices, these approaches circumvent the resource restrictions of traditional NFC systems, allowing for the application of stronger authentication and encryption techniques (Yang et al., 2024).
Additionally, unique solutions consisting of both machine learning (ML) and protocol authentication were identified across various contemporary research (Bouazzouni et al., 2016; Lee et al., 2021; Yang et al., 2024). Papers that applied ML typically leveraged classification techniques under supervised (Bouazzouni et al., 2016; Gurulian et al., 2017; Lee et al., 2021; Rengan, 2023) or semi-supervised models (Yang et al., 2024). Lee et al. (2021) combined supervised deep-learning algorithms and radio frequency (RF) fingerprinting to determine NFC tag authenticity. The system achieved an identification accuracy of 96.16 per cent; however, concerns were raised about how different configurations could impact the ability of the system to interpret the signal characteristics. Inspired by this approach, Bouazzouni et al. (2016) focused on producing a less computationally expensive solution. The authors introduced an intrusion detection system where RF signal characteristics were compared by a random forest algorithm. Conversely, Yang et al. (2024) argue that the context of key-sharing supervised RF authentication is not well-suited given its extreme computational requirements and inability to accurately categorise malicious cards outside of the training dataset. To address this deficit, Yang et al. (2024) explored a semi-supervised model to train and calibrate the score of both legitimate and malicious RF signals and validated its performance in distinct applications.
While a variety of data analysis methods have been applied to enhance NFC security, the use of image-classification techniques to validate the physical features of NFC cards remains unexplored. Additionally, existing academic solutions often overlook usability and deployability. To address these gaps, this paper investigates the application of ML to enhance NFC security by introducing an image-based classification approach to detect cloned access cards. Beyond theoretical analysis, it integrates a classification model into a functional NFC prototype in an experimental setting. The proposed solution prioritises practical usability, ensuring security personnel receive real-time notifications of cloned card usage. This approach strengthens NFC-based access control systems and provides a configurable and deployable system to mitigate unauthorised card use in real-world settings.
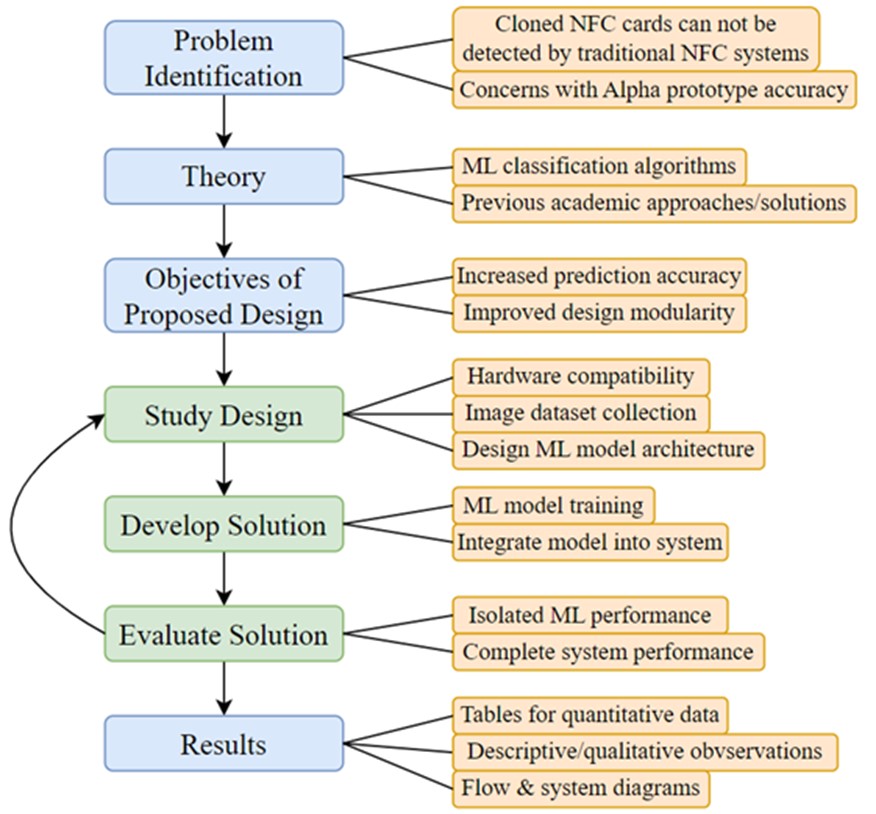
We have chosen design science research as the methodological framework due to its structured approach to designing, prototyping and evaluating solutions in applied research (see Figure 1). Given the need for systematic NFC system integration and iterative refinement, this methodology provides a suitable structure for addressing the research objectives.
Figure 1. The phases of the research design methodology
The theory phase of design involved familiarisation with existing ML solutions applied not only to NFC security but to other image-classification applications. Three common algorithms – namely K-Nearest Neighbour (KNN), Support Vector Machine (SVM) and Convolutional Neural Network (CNN) – were noted due to their prevalence and suitability for similar image-classification use cases (Kanawade et al., 2024). KNN was included due to its simplicity and effectiveness in low-dimensional feature spaces, making it suitable for rapid similarity-based classifications of distinctively different access cards. SVM was selected for its robustness with smaller datasets with complex boundaries, making it suitable for identifying distinct features of keycards based on their visual data. Lastly, CNN was selected as the algorithm excels at learning complex features, enabling it to concentrate on prominent visual elements such as logos or text.
The primary objective was to implement and evaluate a typical NFC access system enhanced with an integrated ML model capable of predicting the visual authenticity of the presented card (Figure 2). The system is subdivided into three subsystems: the NFC reader, the ML model and the alert mechanism. The NFC system mimics traditional access control behaviour using a MFRC522 NFC reader, which allows a user to scan their card and receive an LED indication of whether access is granted or denied. When a unique identifier (UID) is detected, the connected Raspberry Pi Camera Module 2l captures an image of the card. The image is then passed to a pre-trained classification model for analysis. If classified as valid with at least 75 per cent confidence, access is granted. If the features are inconsistent with expected characteristics, the attempt is flagged as fraudulent and access is denied. Failed attempts will also trigger email notifications to relevant security personnel. Source code for this prototype and the implemented algorithms is available on GitHub (Gullotta and Prego, 2025).
Hardware selection for the initial prototype was largely influenced by simplicity, cost-effectiveness and ease of acquisition. The MFRC522 NFC reader, selected for its compatibility with Raspberry Pi microcontrollers, supports reading and writing for ISO/IEC 14443 A/MIFARE and NTAG cards at 13.56MHz (NPX, 2016). The typical signal distance for this module is within 50mm; however, in our instance the card was always scanned within 5mm of the reader. A 3D-printed casing was made for the reader and LED positioning. Testing confirmed that the casing did not affect NFC read accuracy or reliability.
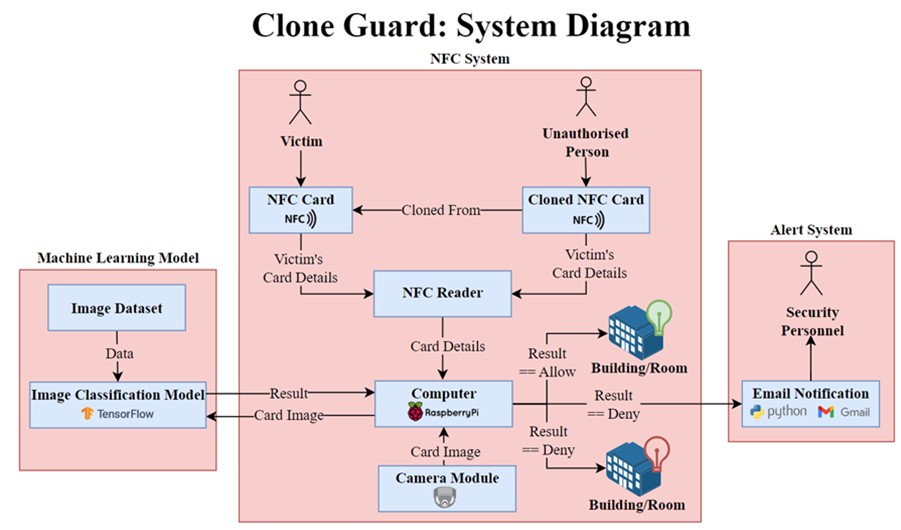
Figure 2: System model of the Clone Guard prototype
Back and front images of 12 cards were collected using a Python script (Gullotta and Prego, 2025) to streamline the collection and categorisation of a sufficient volume and variety of data. The resulting dataset was organised into nine classes (Appendix A). A multi-class approach was chosen over a traditional binary classification to provide greater transparency in the model’s decision-making process.
In total, 2700 images were collected with equal distribution across all classes. To introduce variety, images were captured at time intervals while cards were repositioned between shots. This produced natural differences such as glare, blur and partial framing.
The target class consisted of university student cards. To avoid overfitting to non-relevant details (e.g. a single student’s photo), three different student cards were used. While this is acknowledged as a limitation, CNN heatmap visualisations suggested that the model primarily focused on broader card regions rather than individual faces or IDs. The other categories were selected to represent cards with physical similarities to the target (e.g. colour, layout or text placement), creating a realistic challenge for the classifier. Two datasets were constructed from this process: one with an optimistic noiseless white background and the other with a realistic, noisy background. As part of preprocessing, pixel normalisation was applied to scale values from [0, 255] to [0, 1], ensuring uniform feature contribution during training (Singh and Singh, 2020). No additional augmentation, cropping or custom feature extraction was performed, allowing the CNN to learn features directly from the raw image data.
CNN heatmaps revealed that distinctive background features (e.g. chairs) were influencing model predictions. To address this, two strategies were considered: (1) introducing greater variability in background conditions, and (2) applying preprocessing methods such as cropping or denoising. Given the exploratory nature of this prototype, we adopted the first approach and collected a third dataset of 1200 images with increased background variability. Class labels were also simplified into four categories (see Appendix B), aligning with the practical goal of distinguishing between valid and invalid cards.
The experimental testbed consisted of a CPU laptop with four cores, 16GB RAM and 3.30GHz frequency on which each algorithm was trained and evaluated in separate Jupyter notebooks. The image datasets were categorised in a folder structure, with folder names representing the corresponding class labels.
Python functions from the sci-kit-learn module were used to automate classification reports and confusion matrices for each model. This provided various quantitative values including precision, recall, F1-score and overall accuracy for each class. We also conducted a comparative analysis based on the mentioned metrics and recorded any qualitative observations. Once the most suitable model was identified, it was integrated into the simulated NFC system, and further end-to-end performance testing was conducted manually. The CNN model output was converted into a TensorFlow Lite format to optimise performance.
The objective of the first experiment was to evaluate the suitability of SVM, KNN and CNN classification algorithms for accurately labelling various NFC card types. This experiment aimed to address the first research question by assessing the effectiveness of deep learning in image-classification tasks compared to traditional ML models.
For SVM and KNN, preprocessing involved resizing all images to 23 × 23 pixels, followed by dataset partitioning into training (80 per cent) and validation (20 per cent) sets and 36 testing images, with a fixed random seed of 123. Each partition was normalised by scaling pixel values from [0, 255] to [0, 1]. Prior to testing, hyperparameter optimisation was performed using Scikit-Learn’s Grid Search to determine the best hyperparameter configurations for each model (see Table 1 as well as Appendix C for the CNN model architecture).
Algorithm |
Seed |
Image Dimensions |
Hyperparameters |
CNN |
123 |
240 x 240 |
|
SVM |
123 |
23 x 23 |
{ n_neighbours = 1 } |
KNN |
123 |
23 x 23 |
{ kernel = ‘rbf’, gamma = 0.001, C=10 } |
Table 1. Summary of configuration and parameter values used across the implemented algorithms. CNN model architecture can be found in Appendix C
The CNN model followed a slightly different preprocessing approach. Images were resized to 240 x 240 pixels using OpenCV and split into training (80 per cent) and testing (20 per cent) sets with a random seed of 123. The pixel values were normalised from [0, 255] to the [0, 1] range before being passed directly to the CNN model. The CNN model was implemented using TensorFlow (TensorFlow, 2025) and trained over 10 epochs.
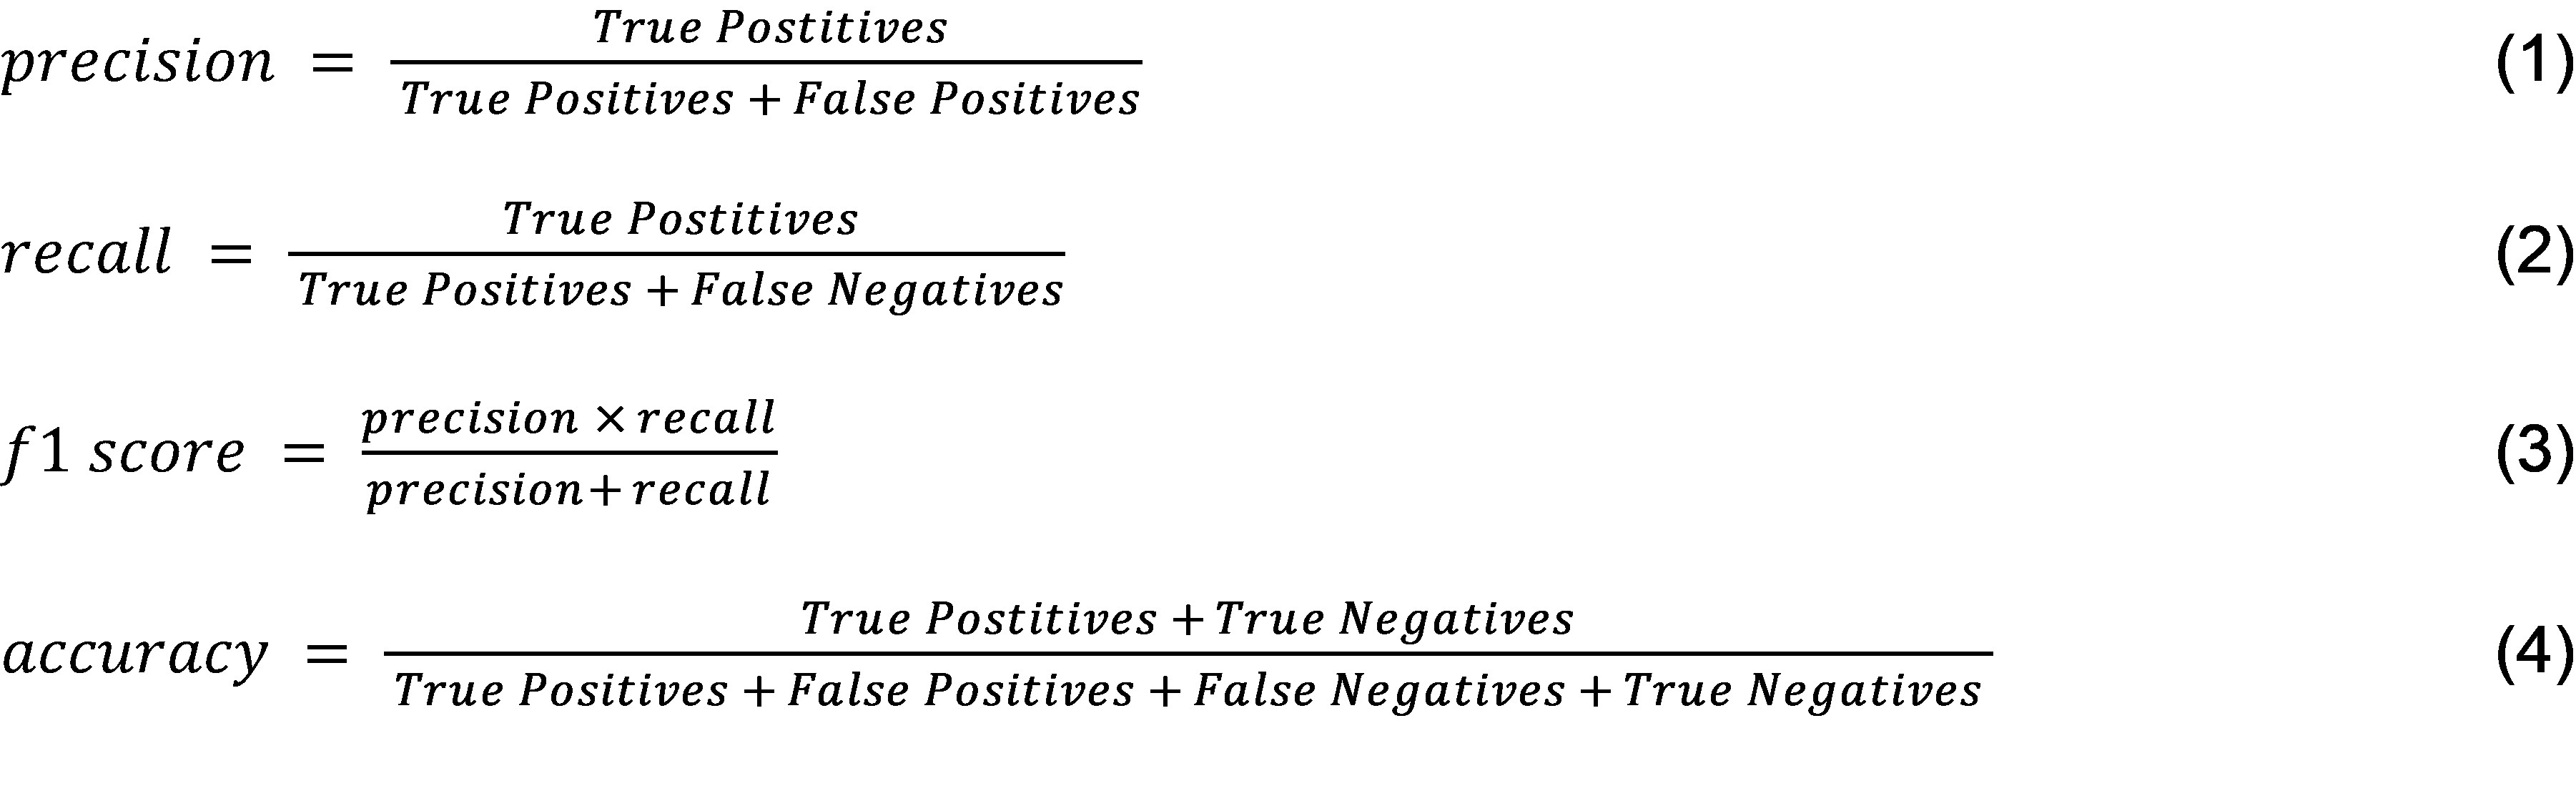
To assess each model’s performance, the trained classifiers were applied to the test dataset, and classification predictions were generated for all nine classes. A comprehensive description of each class is provided in Appendix A. Performance metrics – including precision, recall, F1-score and accuracy as defined in (1), (2), (3) and (4), respectively – were analysed using classification reports and confusion matrices.
SVM Classification Report | ||||
|
Precision |
Recall |
F1-Score |
Support |
BackColour |
0.93 |
0.83 |
0.88 |
52 |
BackDL |
0.92 |
0.82 |
0.87 |
55 |
BackOther |
1.00 |
0.83 |
0.91 |
59 |
Blank |
0.94 |
0.95 |
0.95 |
64 |
FrontColour |
0.62 |
1.00 |
0.76 |
56 |
FrontDL |
0.95 |
0.84 |
0.89 |
64 |
FrontOther |
0.80 |
0.82 |
0.81 |
57 |
UCBack |
0.93 |
0.96 |
0.94 |
70 |
UCFront |
0.96 |
0.79 |
0.87 |
63 |
|
|
|
|
|
Accuracy |
|
|
0.87 |
540 |
Macro Average |
0.89 |
0.87 |
0.87 |
540 |
Weighted Average |
0.9 |
0.87 |
0.88 |
540 |
Table 2: SVM classification results
Referring to Table 2, the SVM model exhibited moderate classification performance, achieving an overall accuracy of 0.87. However, performance varied considerably across classes. In particular, the model struggled with the ‘FrontColour’ class, yielding a relatively low F1 score of 0.76. Despite this, the macro-averaged and weighted F1 scores were 0.87 and 0.88, respectively, indicating that while some class-level imbalances exist, the model performs reasonably well overall.
KNN Classification Report | ||||
|
Precision |
Recall |
F1-Score |
Support |
BackColour |
0.95 |
0.71 |
0.81 |
52 |
BackDL |
0.93 |
0.76 |
0.84 |
55 |
BackOther |
0.93 |
0.97 |
0.95 |
59 |
Blank |
0.71 |
0.95 |
0.81 |
64 |
FrontColour |
1.00 |
0.93 |
0.96 |
56 |
FrontDL |
0.94 |
0.91 |
0.92 |
64 |
FrontOther |
0.93 |
0.96 |
0.95 |
57 |
UCBack |
0.79 |
0.89 |
0.84 |
70 |
UCFront |
1.00 |
0.92 |
0.96 |
63 |
|
|
|
|
|
Accuracy |
|
|
0.89 |
540 |
Macro Average |
0.91 |
0.89 |
0.89 |
540 |
Weighted Average |
0.91 |
0.89 |
0.89 |
540 |
Table 3: KNN classification results
The KNN model slightly outperformed the SVM, achieving an overall accuracy of 0.89 as shown in Table 3. It maintained high precision and recall across most classes, with F1-scores ranging from 0.81 to 0.96. Notably, the ‘FrontColour’ and ‘UCFront’ classes achieved the highest F1-scores (0.96), while ‘Blank’ and ‘BackColour’ were the lowest (0.81). The macro and weighted average F1-scores were both 0.89, indicating consistent performance across classes.
CNN Classification Report | ||||
|
Precision |
Recall |
F1-Score |
Support |
BackColour |
0.95 |
0.94 |
0.94 |
62 |
BackDL |
0.95 |
0.92 |
0.93 |
61 |
BackOther |
0.92 |
0.93 |
0.93 |
61 |
Blank |
0.96 |
0.98 |
0.98 |
52 |
FrontColour |
0.98 |
0.99 |
0.99 |
62 |
FrontDL |
1.00 |
0.98 |
0.98 |
65 |
FrontOther |
0.95 |
0.96 |
0.96 |
56 |
UCBack |
0.96 |
0.96 |
0.96 |
53 |
UCFront |
0.99 |
1.00 |
0.96 |
58 |
|
|
|
|
|
Accuracy |
|
|
0.96 |
540 |
Macro Average |
0.96 |
0.96 |
0.96 |
540 |
Weighted Average |
0.96 |
0.96 |
0.96 |
540 |
Table 4: CNN classification results
The CNN model outperformed both SVM and KNN, achieving the highest overall accuracy of 0.96, as shown in Table 4. Precision, recall and F1-scores exceeded 0.90 across all classes, reflecting strong and consistent classification performance. ‘FrontColour’ achieved the highest F1-score of 0.99, while the lowest-performing classes, ‘BackDL’ and ‘BackOther’, still attained F1-scores of 0.93. Both the macro and weighted average F1-scores were 0.96, underscoring the model’s superior generalisation and accuracy compared to the other models.
The experimental results suggest that CNN offers the most consistent and reliable performance across all classes. The deep-learning model effectively captured feature patterns within the dataset, leading to improved generalisation on unseen test samples.
Despite efforts to maintain consistent dataset partitions, discrepancies arose due to differences in dataset randomisation between Scikit-learn and TensorFlow implementations. This is reflected in variations in class support values across Tables 2, 3 and 4. However, the overall weighted averages provide a reliable basis for model comparison.
CNN exhibited the highest accuracy and consistency, making it the most suitable choice for further experimentation and implementation. This discovery demonstrates the potential of deep learning in NFC security applications, as it effectively distinguishes between visually similar keycards with minimal misclassification.
Experiment 2 aimed to assess how the CNN model performed with different dataset conditions: optimistic (white background), realistic (noisy background), and combined datasets. The goal is to determine which dataset configuration would yield the best generalisation performance while minimising overfitting.
To facilitate this, 36 images (4 from each class) were manually separated from the realistic dataset for use as an independent testing partition. The CNN model from Experiment 1 was used across three training scenarios:
Each model was evaluated using classification reports, confusion matrices and accuracy plots. The learning curves for each test were analysed to examine training and validation loss trends.
Training Dataset Experimentation | |||||||||
|
Optimistic Dataset |
Realistic Dataset |
Combined Dataset |
||||||
Precision |
Recall |
F1-Score |
Precision |
Recall |
F1-Score |
Precision |
Recall |
F1-Score |
|
Macro Average |
0.97 |
0.97 |
0.97 |
0.98 |
0.97 |
0.97 |
0.94 |
0.94 |
0.94 |
Weighted Average |
0.97 |
0.97 |
0.97 |
0.98 |
0.98 |
0.98 |
0.94 |
0.94 |
0.94 |
Table 5: Classification report results for the validation dataset
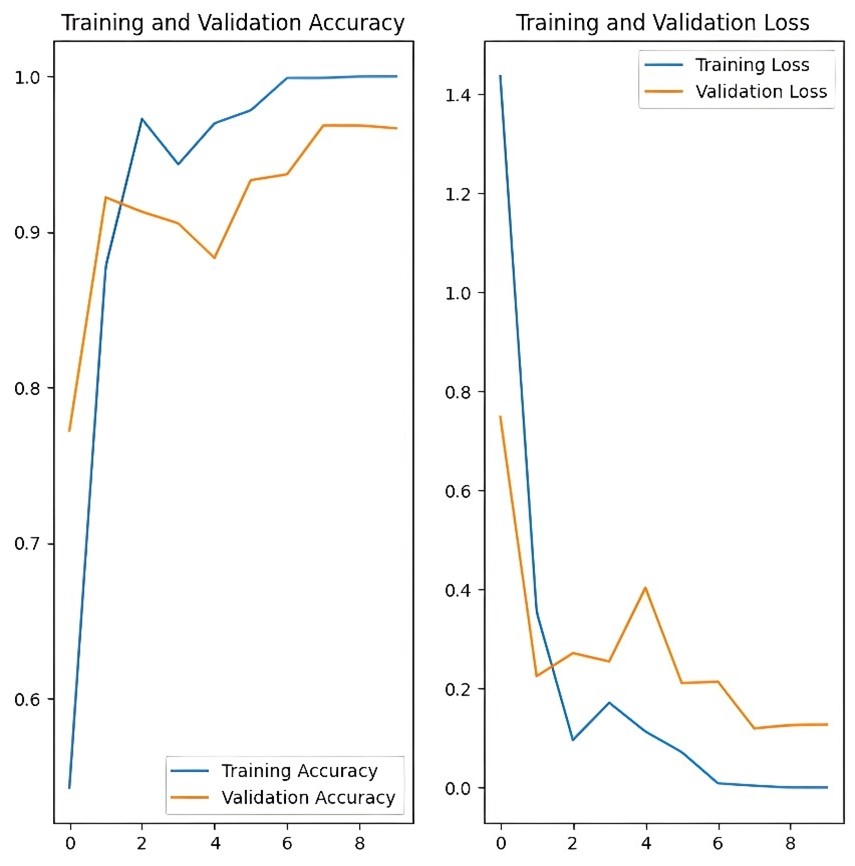
Figure 3: Accuracy and validation loss curves from the model trained on optimistic data over 10 epochs
Test 1 (Optimistic Dataset): The learning curve for the optimistic dataset in Figure 3 showed that training accuracy steadily increased and stabilised near 1.0, while validation accuracy fluctuated around 0.9. Validation loss initially decreased but later exhibited instability, suggesting overfitting.
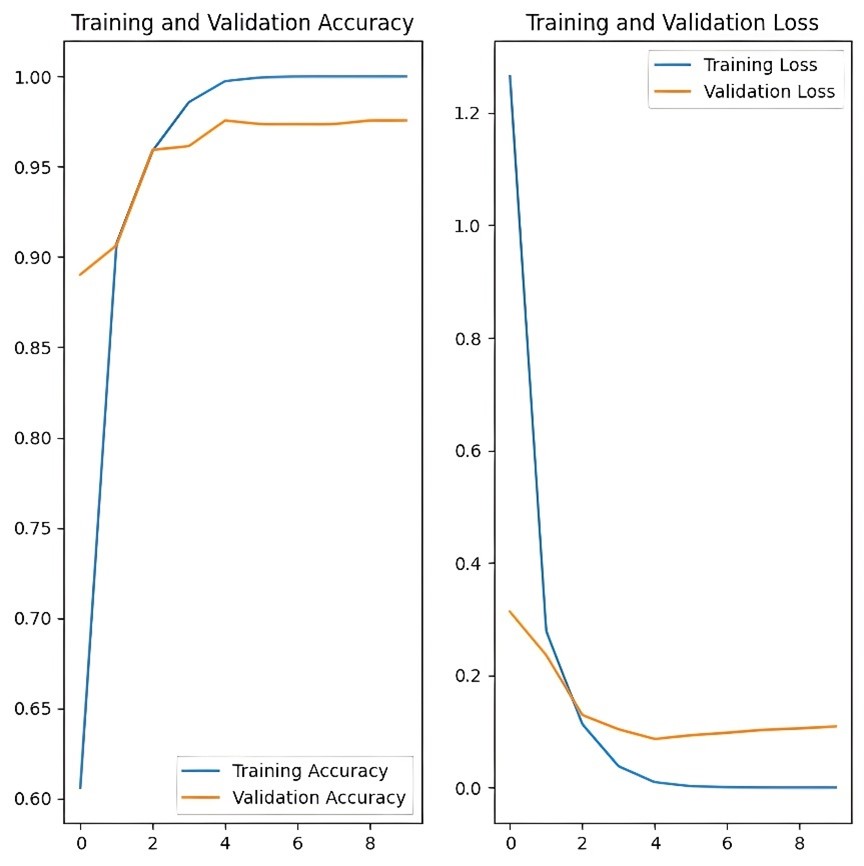
Figure 4: Accuracy and validation loss curves from the model trained on realistic data over 10 epochs
Test 2 (Realistic Dataset): Training accuracy rapidly increased and reached near-perfect levels by epoch 4, while validation accuracy stabilised around 0.95, as shown in Figure 4. The learning curve demonstrated a sharp decline in both training and validation loss, indicating effective learning with minimal overfitting.
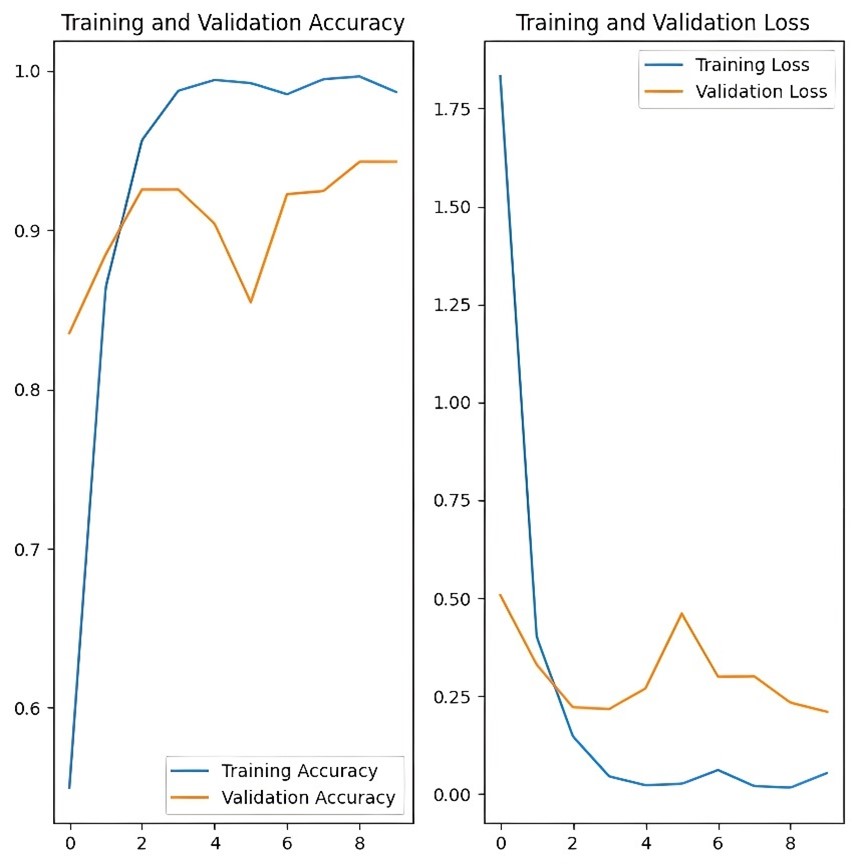
Figure 5: Accuracy and validation loss curves from the model trained on combined data over 10 epochs
Test 3 (Combined Dataset): Figure 5 shows that the training accuracy approached 1.0, but validation accuracy peaked at around 0.9 with fluctuations, suggesting instability in generalisation. Training loss significantly decreased, but validation loss fluctuated between 0.25 and 0.5, indicating potential overfitting during training.
All learning curves (Figures 3, 4 and 5) indicated signs of overfitting, particularly in the third or fourth training epoch. This suggests that the model was beginning to learn from noise within the dataset, leading to increased validation loss, as the CNN memorises irrelevant background patterns instead of generalisable features of the card. The optimistic and combined dataset models exhibited more pronounced fluctuations in validation accuracy and loss compared to the realistic dataset model, indicating that the noise present in the optimistic dataset was influencing the model’s learning process. This could be attributed to reduced object boundary definition, which limited the learning of distinguishing features when predominantly white cards were placed against a uniform white background.
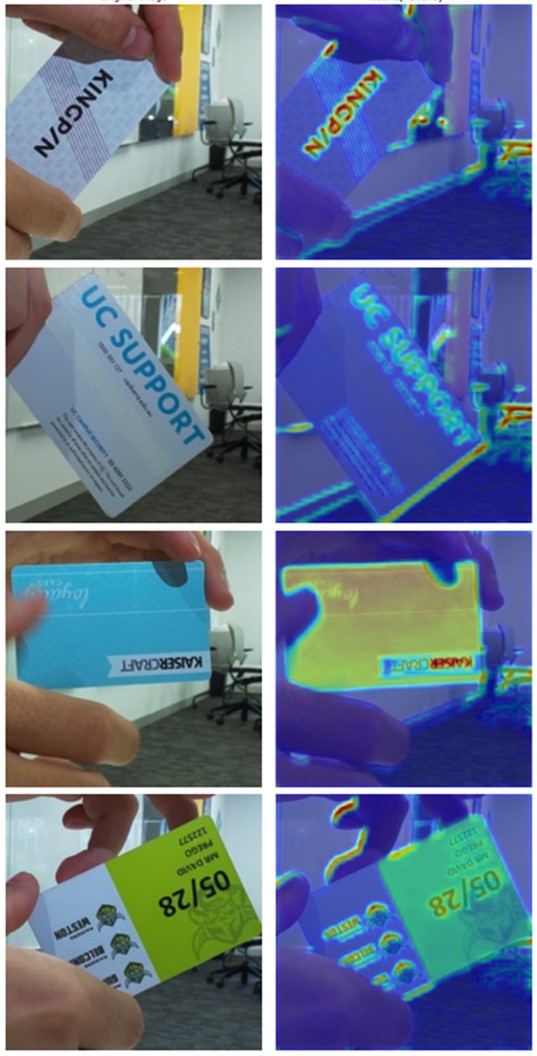
Figure 6: Samples of the Grad-CAM heatmaps indicating the regions of the image that have the most impact on the model’s classification predictions
Given the autonomous feature extraction nature of deep-learning algorithms, it is challenging to determine which regions of an image the model relies on for classification predictions. To address this, a Gradient-Weighted Class Activation Map (Grad-CAM) was applied to the last convolutional layer of the CNN model to generate heatmaps for the testing images (see Figure 6). The heatmaps revealed that distinct colours and bold text regions significantly contributed to the model’s classification process. However, some noise interference from the background was also highlighted in most testing images. While these background regions were relatively small compared to the foregrounded card area, they exhibited high intensity, indicating a strong influence on predictions. Future work should investigate preprocessing methods, such as deterministic noise removal, to mitigate overfitting to dataset-specific noise, thereby improving the CNN’s performance on varied and unseen data.
This experiment successfully refined the dataset selection process, confirming that the realistic dataset with a noisy background is best suited for NFC card classification. This reinforced the decision to use the CNN model trained on the realistic dataset for the final prototype implementation.
Following model experimentation, a refined CNN model trained on a more varied realistic dataset was deployed onto the Raspberry Pi 5 microcontroller for integration testing and performance evaluation. The objective of this experiment was to validate the project’s real-world applicability by assessing Clone Guard’s ability to correctly and timely classify NFC access cards.
To maintain consistency across test scenarios, all manual tests were conducted in a controlled lighting environment using the Raspberry Pi Camera 2 Module. The test procedure involved presenting three different cards to the system’s reader: a valid university student card (front and back tested separately), a blank white card and an invalid card. Each test was repeated ten times to account for potential variability in results due to card orientation. Clone Guard’s response was assessed by recording the following parameters: response time (measured from NFC card read to LED response), predicted classification and confidence score, and actual LED response.
System Performance | |||
Test Case |
Response Time (sec) |
System Accuracy |
Classification Accuracy |
Student Card (Front) |
0.10 |
70% |
90% |
Student Card (Back) |
0.09 |
70% |
90% |
Blank Card |
0.09 |
90% |
50% |
Invalid Card |
0.09 |
100% |
90% |
Table 6: Summary of system performance metrics
For valid university student cards with a confidence score of at least 75 per cent, the expected system response was to activate the green LED, whereas for invalid cards, the red LED was expected as demonstrated in the video here Reinvention Vol18 I2 video for articles. System accuracy for each test suite was calculated based on the number of correct responses.
Overall, these results confirm that Clone Guard performed with high accuracy and confidence across various card types. The findings strongly suggest that the system is viable for real-world deployment, demonstrating the effectiveness of deep-learning algorithms such as CNN in distinguishing between authentic and cloned NFC access cards. However, translating this proof-of-concept into a deployed solution introduces additional considerations beyond model accuracy, particularly around data volume, hardware and system efficiency.
The prototype demonstrated the feasibility of integrating ML into an NFC access system, but several challenges remain before real-world deployment. Most notably, the training dataset was relatively limited in size and diversity, which restricts model robustness under varied conditions. To address this, the NFC-camera system could be deployed without the ML component to collect a larger and more representative dataset before model training. From a hardware perspective, the MFRC522 reader and Raspberry Pi Camera Module 2 were cost-effective selections for prototyping but would likely require upgrading for deployment. More robust NFC readers and higher-resolution cameras could improve reliability and image quality. Additionally, energy consumption was not prioritised in this study, and continuous camera operation combined with real-time ML inference introduces power demands beyond those of conventional NFC systems. Lightweight ML models or specialised microcontrollers with integrated AI acceleration should be explored to address energy concerns. While this work demonstrates technical feasibility, practical deployment will require refinements in datasets, preprocessing, hardware selection and energy efficiency to balance security benefits with system scalability.
This research evaluated the effectiveness of ML algorithms in distinguishing the physical features of NFC access cards, aiming to strengthen NFC access control systems against cloned cards. Experiments demonstrated that deep learning, specifically CNN, can confidently classify unique university student cards among visually similar NFC cards. Further quantitative results identified that training a CNN on a realistic, noisy dataset yielded optimal performance, likely the result of more distinct object boundaries between the cards and background. The study further validated real-world applicability by designing and integrating an end-to-end system capable of capturing card scans and processing card features to determine access eligibility.
Despite these promising results, limitations were observed. Model predictions were occasionally inconsistent due to background noise, potentially the result of the relatively small dataset and the minimal preprocessing applied prior to model training. Future work should explore larger and more varied datasets, along with deterministic noise removal or to enhance classification accuracy and generalisability.
Further optimisation is necessary to enhance Clone Guard’s performance and readiness for large-scale deployment. Future efforts should focus on improving the classification model’s learning and predictive abilities. Hardware limitations and real-time inference requirements of the current system present scalability challenges. For more practical deployment, a purpose-built device with specialised hardware, potentially featuring a card slot for controlled image capture, could significantly improve both usability and system performance.
Overall, this research introduces a novel image-based approach to detecting cloned NFC cards and provides a working prototype that validates the feasibility of a wireless, ML-driven access control system. With targeted refinements, Clone Guard has the potential to evolve into a scalable, secure solution for NFC access protection, laying the groundwork for future advancements in secure access control technologies.
The authors would like to acknowledge the financial support provided by the School of Information Technology and Systems through the Engineering Honours project unit. We would also like to acknowledge the unit convenor, Mohammad Abualsheikh, and the lab technician, Ehsan Amiri Tehranizadeh, for their support.
Figure 1: The phases of the research design methodology (Original image)
Figure 2: System model of the Clone Guard prototype (Original image)
Figure 3: Accuracy and validation loss curves from the model trained on optimistic data over 10 epochs (Original image)
Figure 4: Accuracy and validation loss curves from the model trained on realistic data over 10 epochs (Original image)
Figure 5: Accuracy and validation loss curves from the model trained on combined data over 10 epochs (Original image)
Figure 6: Samples of the Grad-CAM heatmaps indicating the regions of the image that have the most impact on the model’s classification predictions (Original image)
Figure 7: The CNN model architecture used in this research (Original image)
Table 1: Summary of configuration and parameter values used across the implemented algorithms
Table 2: SVM classification results
Table 3: KNN classification results
Table 4: CNN classification results
Table 5: Classification report results for the validation dataset
Table 6: Summary of system performance metrics
Class labels used in Experiment 1 and 2
Class |
Description |
|
UCBack |
Back side of the University of Canberra (UC) student card, containing a barcode, contact information and text. |
|
UCFront |
Front side of the UC student card, showing the university logo, student profile photo and identifying details. |
|
BackOther |
|
|
Blank |
Completely blank card, with no visible text, images or designs. |
|
FrontColour |
Front side of generic membership or loyalty cards, typically featuring coloured graphics, branding or text but not belonging to UC. |
|
FrontDL |
Front side of a driver’s licence, displaying personal details, photo and official licence information. |
|
FrontOther |
Front side of other invalid cards showing branding, logos or designs. |
|
BackColour |
|
|
BackDL |
|
Refined class labels used in the deployed model (Experiment 3)
Class |
Description |
|
ValidBack |
Back side of the University of Canberra (UC) student card, typically containing a barcode, contact information and text. |
|
ValidFront |
Front side of the UC student card, showing the university logo, student profile photo and identifying details. |
|
InvalidFront |
||
InvalidBack |
|
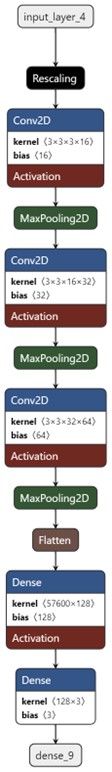
Figure 7: The CNN model architecture used in this research
Ali Khan, M. A., M. H. Ali, A. K. M. F. Haque, F. Sharmin and M. I. Jabiullah (2020), ‘IoT-NFC controlled remote access security and an exploration through machine learning’, 18th ICT&KE, 1–10, available at https://ieeexplore.ieee.org/document/9289881, accessed 17 October 2024.
Bernard, R. (2017), ‘Fixing the gaps in your PACS’, Security Infowatch, available at https://www.securityinfowatch.com/access-identity/article/12293604/fixing-the-gaps-in-your-pacs, accessed 6 April 2025.
Bouazzouni, M. A., E. Conchon, F. Peyrard and P. F. Bonnefoi (2016), ‘Trusted access control system for smart campus’, Intl IEEE UIC/ATC/ScalCom/CBDCom/IoP/SmartWorld, 1006–12, available at https://ieeexplore.ieee.org/abstract/document/7816953, accessed 17 October 2024.
Flipper Devices Inc. (2024), ‘Flipper Zero documentation’, Flipper Doc, available at https://docs.flipper.net/, accessed 23 October 2024.
Gullotta, D. and D. Prego (2025), ‘Clone Guard’ [Computer software]. Available at https://github.com/daniegee/clone-guard, accessed 17 September 2025.
Gurulian, I., C. Shepherd, E. Frank, K. Markantonakis, R. N. Akram and K. Mayes (2017), ‘On the effectiveness of ambient sensing for detecting NFC relay attacks’, IEEE Trustcom/BigDataSE/ICESS, 41–49, available at https://ieeexplore.ieee.org/document/8029421, accessed 16 October 2024.
Kanawade, S., S. Jangade, A. Mane and T. Kurne (2024), ‘Counterfeit currency detection using machine learning’, International Journal of Scientific Research in Science, Engineering and Technology, 11, 399–405, available at https://www.researchgate.net/publication/381692208_Counterfeit_Currency_Detection_Using_Machine_Learningaccessed 17 October 2024.
Lee, W., S. Y. Baek and S. H. Kim (2021), ‘Deep-learning-aided RF fingerprinting for NFC security’, IEEE Communications Magazine, 59 (5), 96–101, available at https://ieeexplore.ieee.org/document/9446687, accessed 22 October 2024.
NPX (2016), ‘MFRC522 Standard performance MIFARE and NTAG frontend’, available at https://www.nxp.com/docs/en/data-sheet/MFRC522.pdf, accessed 15 September 2025.
Rengan, B. K. (2023), ‘Smart acquiring platform in contactless payments using advanced machine learning: Security controls using device recognition, Geo Fencing and customer on file’, IEEE LISAT, 1–7, available at https://ieeexplore.ieee.org/document/10179552, accessed 17 October 2024.
Singh, D. and B. Singh (2020), ‘Investigating the impact of data normalization on classification performance’, Applied Soft Computing, 97, available at https://www.sciencedirect.com/science/article/abs/pii/S1568494619302947, accessed 22 October 2024.
Singh, M. M., K. Adzman and R. Hassan (2018), ‘Near Field Communication (NFC) technology security vulnerabilities and countermeasures’, International Journal of Engineering and Technology, 7 (4), 298–305, available at https://www.researchgate.net/publication/329642316_Near_Field_Communication_NFC_Technology_Security_Vulnerabilities_and_Countermeasures, accessed 17 October 2024.
TensorFlow (2025), ‘TensorFlow’, TensorFlow, available at https://www.tensorflow.org/, accessed 23 October 2024.
Yang, Y., Y. Xun, Y. Yan, J. Liu and Z. Jin (2023), ‘NFC-IDS: An intrusion detection system based on RF signals for NFC security’, IWCMC, 494–99, available at https://ieeexplore.ieee.org/document/10182412, accessed 17 October 2024.
Yang, Y., Y. Xun, T. Lv and J. Liu (2024), ‘NFC-RFAE: Semi-supervised RF authentication for mobile NFC card system’, IEEE WCNC, 1-6, available at https://ieeexplore.ieee.org/document/10571104, accessed 17 October 2024.
Near-Field Communication: Short-range wireless technology that enables data exchange between devices
Machine learning: A subset of artificial intelligence that enables computers to learn from data, identify patterns and make decisions with minimal human intervention
Random forest algorithm: A machine learning method that combines multiple decision trees to make more accurate and stable predictions
Image-based classification approach: A technique that uses images to train models to recognise and categorise visual features
Design science research: A research method focused on prototyping practical solutions to solve real-world problems while contributing to scientific knowledge
Multi-class approach: A type of classification where the model learns to distinguish between three or more categories
Overfitting: When a model learns patterns that are too specific to the training data, performing well on it but poorly on new, unseen data
Heatmap visualisations: Graphical display that use colour intensity to show where a model focuses most when making decisions
Classification report: A performance evaluation metric for classification models that provides key statistics such as precision, recall and F1-score for each class in a dataset
Confusion matrix: A visual summary of the model’s correct and incorrect predictions
Precision: Percentage of positive instances out of the total predicted positive instances
Recall: Percentage of positive instances out of the total real positive instances
F1-score: The mean of precision and recall values, providing a single metric to evaluate the performance of a classification model
Deep learning: A subset of machine learning that uses artificial neural networks with multiple layers to model complex patterns and representations in large datasets.
Fixed random seed: A predefined number used to control random processes in experiments so that results can be exactly reproduced each time
Hyperparameter: A setting chosen before training a model that influences how well the model learns from data
Noisy dataset: In the context of this research, a collection of images with cluttered backgrounds used to make the model more robust to real-world variation
To cite this paper please use the following details: Gullotta, D.R. (2025), 'A Machine Learning Approach to Augment Security in NFC-Based Access Control Systems', Reinvention: an International Journal of Undergraduate Research, Volume 18, Issue 2, https://reinventionjournal.org/index.php/reinvention/article/view/1931/1558. Date accessed [insert date]. If you cite this article or use it in any teaching or other related activities, please let us know by emailing us at Reinventionjournal@warwick.ac.uk.
https://doi.org/10.31273/reinvention.v18i2.1931, ISSN 1755-7429, © 2025, contact reinventionjournal@warwick.ac.uk. Published by the Institute for Advanced Teaching and Learning, University of Warwick. This is an open access article under the CC-BY licence (https://creativecommons.org/licenses/by/4.0/)