August Küenburg, University of Warwick
The fiscal rules of the Stability and Growth Pact have consistently failed to enforce good fiscal governance and contain rising debt ratios across euro area economies. This article illustrates the unsustainable nature of Greek fiscal policy prior to the global financial crisis and argues for the adoption of fiscal standards to improve fiscal policy. This will require a common and transparent framework for debt sustainability analysis. An evaluation of the euro area’s newest member along the lines of sustainable fiscal governance shows that Croatia is in a stronger fiscal position than Greece was after adopting the euro. Moreover, the resilience and crisis management methods of the Eurozone as a whole have improved significantly. To safeguard against future crises and prepare euro area economies for the fiscal strain of ageing populations and climate change, however, the Eurozone needs to transition from fiscal rules to fiscal standards.
Keywords: Debt dynamics, debt sustainability analysis, fiscal standards, fiscal rules, sustainable fiscal governance, Greek debt crisis
Government debt ratios across OECD economies have been on the rise since the 1970s. Although there are large cross-country differences in past debt accumulation among this club of mostly high-income economies, fiscal balances have had the largest impact on rising government debt (Rawdanowicz et al., 2021). The creation of the modern welfare state has vastly expanded government budgets. Fundamental challenges such as the ageing of populations and the effects of climate change are straining public finances. Fiscal policymakers are increasingly constrained by their governments’ high levels of debt and struggle to finance the long-term investments required to stop climate change. There is a need for a paradigm change in the way bond markets price rising government debt levels. This article promotes the idea that high-debt ratios on their own should not immediately be of concern as long as there is a high probability that these ratios are sustainable. Understanding what makes a debt path sustainable – or, in the case of Greece, unsustainable – is vital to assess whether a country has the capacity to take on more debt to finance the green transition. In the Eurozone, this will require moving from ineffective fiscal rules towards fiscal standards. This has the potential to improve fiscal governance across euro area economies and make the whole Eurozone more resilient against future symmetric and asymmetric shocks. Finally, using fiscal standards to analyse the debt dynamics of the euro area’s newest member helps to understand why Croatia is unlikely to go down the same path as Greece did after joining the European monetary union.
Sustainable government debt is often defined as a state where a government is able to service all of its financial obligations, and the probability of the debt ratio exploding is very low. How to assess whether a country’s debt obligations are sustainable or not is central to the field of debt sustainability analysis. The following equations are used in the traditional discussion and provide valuable insights into the fundamentals of debt dynamics (Carlin and Soskice, 2015: 518). A government budget constraint for the period is given by:
The government budget identity requires that expenditure and revenue are equal. On the expenditure side, we have government expenditure and the cost of servicing debt as the interest rate times the amount of debt in the previous period . Expenditure is financed by tax revenue , new debt and new money . Printing new money is a desperate measure that governments may resort to when they are unable to issue new debt or raise tax revenues. Debt monetisation can lead to hyperinflation – something that most central banks today avoid at all costs as part of their inflation-targeting regime (Carlin and Soskice, 2015: 517). In this case, we therefore exclude debt monetisation and assume that is zero. All variables in the budget identity are in nominal terms.
Government deficits are central to the debt sustainability discussion. The primary government deficit is the difference between government spending and taxes excluding transfers. It serves as a first indicator of a government’s short-term fiscal sustainability. The actual deficit adds the interest on existing debt to the primary deficit. By rearranging the budget identity, we determine that the actual deficit is equal to the change in debt:
The total debt stock for a period t is consequently given by :
Debt in absolute terms does not account for the size of the economy. Dividing by nominal GDP gives the debt ratio :
Similarly, we divide the previously determined actual government deficit to obtain the budget deficit to GDP ratio . To simplify the formula, we introduce as a notation for the primary deficit to nominal GDP ratio .
We continue without using the time notation . The aim is to identify the determinants that move . While the debt stock is , we approximate the change in the debt stock as a function of the changes in the debt ratio , prices and real GDP .
The next step is to divide by nominal GDP and identify the inflation rate and GDP growth as and respectively.
Using our previous equation for , we can rewrite the change in the debt-to-GDP ratio as:
and apply the Fisher rule to arrive at the central equation to this debt dynamics discussion:
This formula is an obvious abstraction, and economists usually use stochastic techniques to model debt dynamics. Nevertheless, we now have a simple equation that defines the nett debt ratio change as a function of the real interest rate , the economic growth rate , the previous period’s debt ratio and the primary deficit ratio . There are two situations in this formula: either real interest exceeds growth or vice versa. If the government were to run a stable primary balance, this would lead to a gradual increase or decrease in the debt ratio. Although primary deficits have a negative impact on the debt ratio, governments can still pursue a stable debt ratio if economic growth exceeds the real interest paid on the debt . Observers might point out that inflation reduces the real value of debt and could therefore facilitate debt reduction. This works for old debt but would also increase the yields investors demand on new debt. Inflation is therefore not a simple solution to high government debt, as it complicates the debt rollover process.
The sign of can be subject to abrupt changes and can only be determined with probabilities. Furthermore, Carlin and Soskice (2015) suggest that since the global financial crisis, sovereign default risk has played an increasingly important role in this equation. Investors no longer assume that governments will always be able to service their debts, and therefore demand a risk premium when a country’s debt stock begins to look unsustainable. Decomposing the real interest rate into the real risk-free interest rate and a risk premium better illustrates how expectations influence debt dynamics.
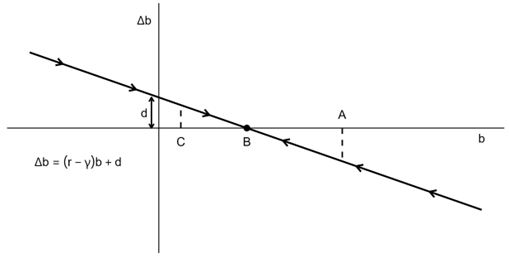
Greece joined the EMU on 1 January 2001. The following calculations analyse AMECO (2023) data for the years 2002–2008. During this period, the Greek economy grew at an average annual rate of 6.9 per cent, while long-term nominal interest rates averaged only 4.4 per cent. The interest rate-growth differential is therefore -2.5 per cent. A negative interest rate-growth differential is favourable for public finances as it favours debt reduction, provided the government does not run substantial primary deficits. Figure 1 plots the debt dynamics equation for Greece in the period 2002 to 2008. The slope is negative because growth exceeded interest rates and is equal to the interest rate-growth differential for the period. Moreover, the government ran an average primary deficit of -2.6 per cent. There are three different conditions on this curve: At point A, the change in the debt ratio is negative and will result in the overall debt ratio falling towards point B. This reduction in the debt ratio is being achieved in spite of a primary deficit. In this situation, the economy outgrows the government’s debt. At point B, the debt ratio is stable. The debt ratio will remain constant as long as the differential and deficit remain unchanged. Finally, at point C, the debt ratio will rise towards the stable point B. Here the negative effect of the primary deficit on the debt ratio dominates.
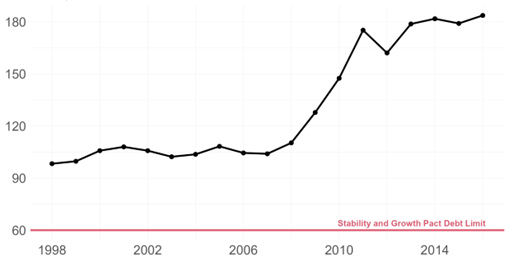
We can rewrite the debt dynamics equation as to find the debt stabilising ratio for Greece over our seven-year period. The calculated ratio amounts to 104 per cent. The actual debt ratio averaged 105.6 per cent. Furthermore, Figure 2 shows that Greek debt as share of nominal GDP remained more or less stable around this average. The minor difference between the calculated and the observed ratio may be the product of the actual interest rate on government debt differing from the long-term nominal interest rate.
The numbers suggest that during this period of exceptional economic growth, the Greek government used the favourable interest rate-growth differential to run higher primary deficits. Closely coordinated deficits with the stable debt ratio slightly above 100 per cent imply that Greece did not design fiscal policy to facilitate debt reduction.
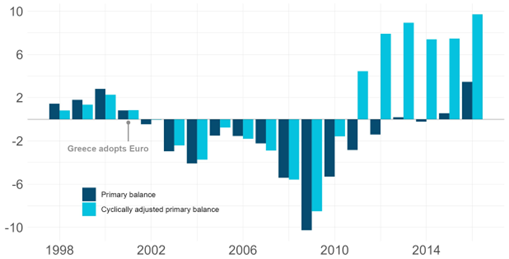
Greece’s fiscal stance in years of economic growth shows clear signs of deficit bias. A prudent fiscal policy stance would entail fiscal contraction during economic upswings to finance fiscal expansion in times of recession. Conversely, Greece continued its expansionary fiscal policy as long as the debt ratio remained constant (Figure 3).
Carlin and Soskice (2015) identify a preference for borrowing over taxation as a symptom of debt bias. According to World Bank (2023), Greece’s tax revenue as a percentage of GDP was only 19.1 per cent in 2003, while Denmark’s was 31.3 per cent. Song et al. (2012, cited in Carlin and Soskice, 2015) suggest that different preferences for public goods may be central to understanding the motivation behind deficit bias. Governments that provide high-value public goods have a more prudent fiscal policy stance. The Scandinavian countries are a good example in Europe. Conversely, countries such as Greece and Italy provide fewer public goods and borrow more. The theory is that there is less intergenerational altruism in the latter countries, and voters therefore prefer to pass on the debt burden on to the next generation. The key is for voters to believe sufficiently in the future provision of public goods to vote for fiscal consolidation in the short run. Greece arguably lacked this level of intergenerational altruism and foresight during the period of high economic growth and low interest rates.
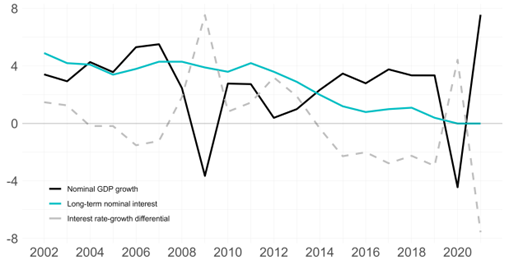
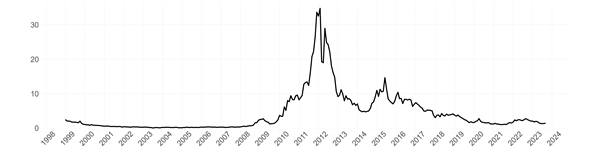
Favourable interest rate-growth differentials do not last forever, so debt is not a free lunch. Economic growth and interest rates can fluctuate arbitrarily due to external factors, as shown by Figure 4 for the euro area. While the debt ratio may appear stable in one period, a change in the interest rate-growth differential could turn the same ratio into a highly unsustainable position. Figure 5 shows how interest rate-growth differentials have varied within Germany and Greece.
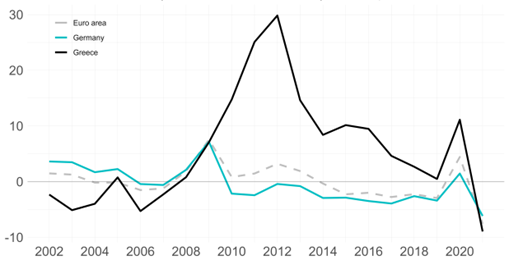
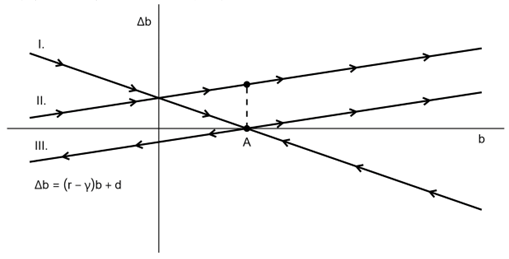
After the onset of the global financial crisis, Greece’s previously stable debt ratio was at risk. The differential climbed from 0.8 per cent in 2008 to 7.1 per cent in 2009, 14.7 per cent in 2010 and peaked at a staggering 29.8 per cent in 2012 (AMECO, 2023). Figure 6 shows how a stable ratio can become unsustainable from one period to the next. Initially, the differential is negative and the government runs a primary deficit. The debt ratio remains stable at point A. In the next period, nominal long-term interest rates exceed the nominal growth rate. The debt dynamics function now slopes upwards and point A is no longer a stable debt ratio. As indicated by the arrows, in this scenario every debt ratio will eventually explode unless some of the other parameters change. Point A is now at risk of becoming unsustainable. If the government has the fiscal capacity to reduce its deficit, or even run a primary surplus, the debt ratio at point A can become constant again. Graphically this is illustrated by the third line, which has been downwards shifted by the improved primary balance. In the third scenario, the debt ratio at point A is constant but no longer stable. Improving the primary balance can be difficult for the government, as it must either reduce government spending or increase taxes.
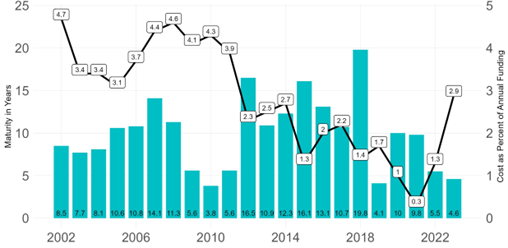
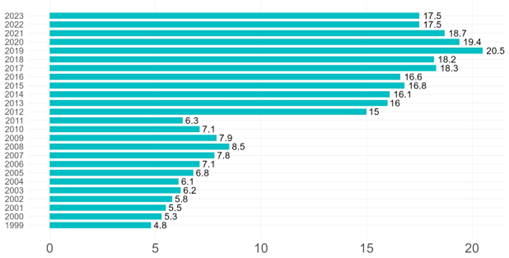
The Greek government was not able to improve its primary balance and therefore the debt ratio deteriorated as shown by the arrows in the second line of the graph. Rising debt ratios raise concerns about a country’s ability to service its debt. The rising risk premium demanded by investors above the risk-free real interest rate will increase the cost of new debt. Figure 7 shows the weighted average maturity and cost of new annual funding. During the financial crisis, Greece not only had to pay more interest on newly issued debt, but also found it difficult to issue long-term debt. A global credit crunch and concerns about Greece’s solvency drastically reduced the average maturity of newly issued bonds. The weighted average maturity of new annual funding dropped to a low of 3.8 years in 2010 with the average maturity of total debt decreasing from 8.5 years in 2008 to 6.3 years in 2011 (Figure 8).
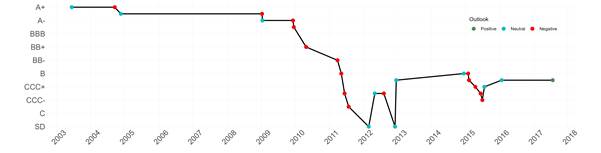
The global financial crisis and the ensuing Eurozone debt crisis hit peripheral European economies such as Spain, Greece and Ireland hard. First the primary balance deteriorated amid the global economic crisis, state interventions in the economy and the need to bail out financial institutions. Credit ratings for more indebted and vulnerable European economies deteriorated, as can be seen by Standard & Poor’s credit rating of Greece in Figure 9. Risk premiums climbed in response and credit began to dry up. Finally, economic growth collapsed during the recession, reducing government revenues and further worsening the primary balance. By 2012, Greece had defaulted on its debt. The ensuing debt restructuring became the largest of its kind.
Greece’s fiscal position was on a good trajectory when it joined the EMU in 2001. The primary balance had been positive for the previous seven years, averaging at 1.8 per cent of nominal GDP (IMF, 2023). Ever since the European exchange rate mechanism crisis in 1992, which caused the debt ratio to rise from 80.6 per cent in 1992 to 101.1 per cent in 1993, Greece’s debt had remained stable and stood at 108 per cent in 2001 (IMF, 2023). Joining the euro area meant that Greece could benefit from euro area monetary policy. As determined previously, Greece did not consolidate fiscal policy in the years of economic growth following its adoption of the euro. The Greek government expanded its fiscal position under the improved financing conditions in the EMU. There are multiple channels through which EMU participation manifested itself in better credit conditions for the Greek state. This article aims to highlight the role of the European collateral system in potentially distorting Greek sovereign bond yields. How the European Central Banks’s (ECB) operational framework is equipped to provide effective money market management helps to understand the important role of collateral in the Eurosystem.
Open market operations are the ECB’s main mechanism to conduct monetary policy. These operations manage liquidity in the Eurosystem and consist of the main refinancing operations, longer-term refinancing operations, fine-tuning operations and structural operations. To support overnight liquidity within the Eurosystem, the ECB has the standing facilities at its disposal. Standing facilities contain the marginal lending facility and the deposit facility. The most frequently used tools to manage money supply and interest rates are the one-week main refinancing operations, three months longer-term refinancing operations, and the overnight marginal lending facility. Counterparties’ access to these tools are conditional on collateral. The Eurosystem Collateral Framework enables a large number of solvent and supervised counterparties to use these instruments to match their respective liquidity needs. Central banks such as the ECB do not face the same liquidity constraints that other financial institutions might encounter in crisis. The ECB has therefore the capacity to provide solvent but temporary illiquid financial institutions with credit, while taking over fewer liquid assets as collateral (Bindseil et al., 2017). Saving healthy institutions with temporary liquidity constraints is vital for the economy. According to Bindseil et al. (2017) credit in the Eurosystem is conditional on collateral as the risk management associated with unsecured lending is infeasible. To provide credit without collateral would require the central bank to thoroughly analyse counterparties and operate with different interest rates. One unique feature of the Eurosystem is that one set of collateral applies to all instruments. Other central banks such as the Bank of England or Federal Reserve distinguish between different operations. To avoid moral hazard and over-reliance on central bank credit, strict rules for haircuts apply. The objective of this framework is to enable financially sound institutions to access funds during periods of financial difficulty in a universal and transparent manner.
Greek government bonds were first upgraded to the status of eligible assets when Greece formally joined the Eurosystem. From that moment on, the euro area’s financial institutions could use Greek bonds as collateral to access ECB credit and satisfy their liquidity needs. As a consequence, Greek debt became more attractive as an investment. Whereas previously German bonds were deemed safer and could be used to access credit at the ECB, Greek bonds became a cheaper alternative method to access the same credit. The inclusion of Greek bonds on the ECB’s list of eligible assets may have played a significant role in the decrease of Greek bond yields, driven by heightened demand and a resulting increase in their price. Financial institutions may have ignored underlying structural differences and considered the risk to Greek bonds to be more or less equal to other Eurozone bonds since these economies shared the same currency (Figure 10).
Therefore, one could argue that the European collateral framework had distortionary effects on financial markets. In hindsight, the market pricing of Greek bonds did not reflect the underlying risks of debt-biased fiscal policy pursued by the Greek government. Further analysis of the ECB eligible assets database could provide interesting insights into what kind of maturities were indirectly promoted by the European collateral framework. This selection could have impacted the demand for specific Greek bonds and therefore affected Greece’s overall weighted average maturity.
The EMU is a unique economic and political experiment and successor to the European monetary system (EMS). In the EMS, countries engaged in a fixed exchange rate agreement, which proved vulnerable to second-generation speculative attacks. High capital mobility in Europe and monetary tightening in post-reunification Germany made exchange rate commitments incredible. According to De Grauwe (2023), many EU countries hoped to eliminate the threat of speculative attacks on their currencies by joining the euro. The removal of fixed exchange rates through the creation of a monetary union or adoption of floating exchange rates as part of an inflation-targeting regime reduced the threat of speculative attacks in the twenty-first century (Rose, 2023). Along with the creation of the monetary union in Europe, new problems emerged. Since countries in the EMU do not control their currency, their credibility to service their debt suffers (De Grauwe, 2023). The EMU therefore replaced the risk of devaluation with the risk of default in the bond markets. Serious concerns over the integrity of southern European bonds started to pick up in 2010 and marked the beginning of the sovereign debt crisis. By 2012, Greece had defaulted, and its debt had to be restructured. In contrast to the euro’s first decade in existence, the second one proved to be more tumultuous. The fiscal framework had not adequately prepared Eurozone economies for economic shocks, such as the global financial crisis and the ensuing credit crunch.
Past legislation, such as the Maastricht Treaty and the Stability and Growth Pact (SGP), centred around fiscal rules to enforce prudent fiscal governance. Blanchard et al. (2021) suggest that during the early days of the EMU simple fiscal rules – namely, the 60 per cent debt to GDP and 3 per cent deficit limits – might have been essential to establish credibility. Shortcomings of these simple rules became apparent when they prevented adequate counter-cyclical fiscal responses during severe economic downturns, with the effect of unnecessarily prolonging recessions. In addition to forced fiscal consolidation during recessions, fiscal rules also failed to curb excessive spending during economic expansions, such as the one preceding the global financial crisis. The authors suggest that EU fiscal rules or standards should only serve the original purpose of preventing negative debt externalities from spilling over between member states and threatening the financial stability of the Eurosystem. The structural differences between the economies covered by the current framework of fiscal rules remain too large to be effectively managed by the original 60 per cent debt to GDP and 3 per cent deficit limits. Frequent violations and a lack of enforcement have led to many ad hoc amendments, turning the previously simple targets into a complex framework of fiscal rules. Fiscal rules have ultimately failed to contain the rise of debt levels all over the Eurozone.
Blanchard et al. (2021) identify two approaches to overhauling the European Union’s fiscal framework. The first more ambitious, albeit politically less feasible, is the creation of a European fiscal union capable of dealing with asymmetric economic shocks. This would involve expanding the EU budget, increasing risk sharing and issuing common debt. The second approach aims to transform EU-level fiscal rules to resemble fiscal standards that can be applied more idiosyncratically. The advantage of fiscal standards would be that they could focus solely on safeguarding the stability of the monetary union while allowing countries to develop their own preferred fiscal rules or standards adapted to their individual needs. These preferences may include financing climate investments, policies to smooth the business cycle and individual targets for debt levels. EU-level fiscal standards could ensure that, in addition to debt levels and deficits, other relevant factors are taken into account. Blanchard et al. (2021) suggest these standards should be enshrined in EU primary legislation and have the aim of keeping debt levels sustainable at a high probability. The European Fiscal Board would then assess whether a member state’s debt level is sustainable using a stochastic debt sustainability analysis model. Stochastic debt sustainability analysis is a powerful tool for modelling future paths of economic growth and interest rates under uncertainty and determining the probability of unsustainable dynamics in the debt ratio. Inputs and assumptions in this model have to be transparent. One reason why the SGP lacked credibility was its weak enforcement. Member states do not wish to give up sovereignty over fiscal policy decisions, and citizens are not sufficiently aware of debt externalities across the Eurozone. Blanchard et al. (2021) propose changes to national laws to give either national independent fiscal institutions (IFIs) or the European Commission some say in the national budgetary approval process. Alternatively, EU treaties could be changed to establish the European Court of Justice as a supranational and independent adjudicator. Beetsma (2023) points out that IFIs monitor their own governments fiscal policies, criticise budgetary processes and identify shortcomings in government publications and projections. While countries benefit from positive spillover effects of neighbouring IFIs, they see their own IFI as a liability. According to Beetsma (2023), the European Commission and European Parliament would therefore have to enforce the elevated role of IFIs to solve this prisoner’s dilemma. Expanding the role of IFIs to conduct debt sustainability analyses and force corrective action in case of unsustainable fiscal practices would be met with resistance from national governments. If the public can be convinced of the positive effects on economic outcomes, introducing fiscal standards via IFIs would be more politically feasible than through a supranational institution. In contrast to fiscal rules, this framework of fiscal standards should allow countries to implement their preferred fiscal strategies as long as their debt remains sustainable and avoids debt externalities across the Eurozone.
The twin crises was the first major challenge to the EMU and brought it to the brink of collapse. The crises can be traced back to a lack of collective crisis management tools that was a significant factor in pushing the euro area from the global financial crisis into the euro area sovereign debt crisis (Lane, 2021). In accordance with the saying that Europe is forged in crisis, lessons have been learnt and reforms have been taken ever since the euro area experienced its first major crisis.
Analysing various macro-economic variables across the euro area, Lane (2021) finds that the resilience of the monetary union has grown significantly since the twin crisis. By looking at the inter-quartile range of GDP growth, inflation, current account balance and budget balance, he finds that overall dispersion is lower than in the pre-crisis period. Most notably, current account deficits and fiscal deficits, which combined are a risk to macro-prudential outcomes, have largely been absent. Although the debt levels have climbed to new heights after the sovereign debt crisis, Lane (2021) suggests that some vulnerabilities have been eliminated by increased capital-asset ratios in the banking sector that benefit loss-absorbing capacity. The solvency ratio of significant financial institutions has grown from 15.84 per cent in the second quarter of 2015 to 19.60 per cent in the first quarter of 2023 (ECB, 2023). As of recently, OECD economies’ interest rates have been on a downwards trend that started in the 1980s. Excess saving in the economy, excess demand for safe assets and a loosening of monetary policy in response to recessions without subsequent tightening affected this fall (Rawdanowicz et al., 2021). Lane (2021) identifies the period succeeding the twin crisis of 2014–2019 as a period of relative calm. EU–IMF adjustment programmes in Greece, Ireland, Portugal and Cyprus assured investors that euro area resilience was a political priority. The European Stability Mechanism (ESM), established in 2012, provided financial assistance programmes to member states in financial distress. ESM loans are financed through common ESM bonds. The sale of ESM bonds provides funds at a cheaper rate than sovereign bonds from countries seeking ESM assistance. In addition to the ESM, the Outright Monetary Transactions (OMT) programme was also launched in 2012 to calm financial markets and eliminate the very acute risk of large divergences in short-term bond yields. According to Lane (2021), the ESM and OMT programmes were crucial in alleviating pressure from the more intense phase of the euro area sovereign debt crisis.
Along with crisis management tools, the euro area has also made progress in preventing future crises. The creation of the banking union with its two major instruments, the Single Supervision Mechanism (SSM) in 2013 and Single Resolution Mechanism (SRM) in 2014, have been central to boosting the resilience of the financial sector by allowing for increased coordination and supervision of national macro-prudential policy measures.
The COVID 19 crisis was the first large scale test of the euro area’s new crisis management methods. In addition to already existing facilities, a new macro-economic stabilisation instrument was created with the €750 billion Next Generation EU programme (NGEU). Checherita-Westphal et al. (2022) attribute NGEU together with an adequate monetary and fiscal response to aiding the economy surpass its pre-crisis real GDP level in the fourth quarter of 2021. Notably, countries with the largest NGEU allocations are also more prone to have less sustainable debt (EC, 2022b, cited in Checherita-Westphal et al., 2022). Therefore, NGEU is a small step towards European fiscal union.
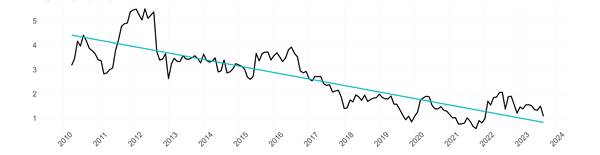
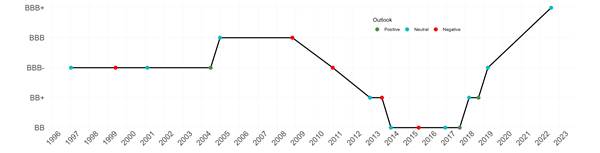
On 1 January 2023 Croatia became the twentieth member of the Eurozone and the twenty-seventh member of the Schengen area. Preparations for this transition had been long in the making. After joining the EU in 2013, Croatia became subject to the preventive arm of the SGP in 2017 and entered the European Exchange Rate Mechanism II in 2020. This latest development pegged the kuna to the euro at a rate of 7.53450. To consolidate this fixed exchange rate system, the ECB agreed on a €2 billion swap agreement with the Croatian national bank (HNR). Integration into the SSM and SRM followed. The ECB now directly supervises significant institutions and indirectly supervises less significant institutions through national supervisors. Croatian debt had already entirely been denominated in euros prior to adoption of the single currency (ECB, 2022). The convergence reports of the European Commission (EC, 2022a) and ECB (ECB, 2022) both concluded that the Croatian economy had significantly converged to the euro area in fields ranging from price stability and long-term interest rates to supervision and structural reforms. Investors and rating agencies have taken note of these developments as can be seen by the declining trend in Croatian-German bond spreads (Figure 11) and a decade high credit rating (Figure 12).
Reforms carried out during the accession period to the Euro boosted Croatia’s resilience and crisis management capabilities. Real GDP growth of 6.2 per cent in 2022, representing the fourth highest rate in the EU, is a clear testament to these reforms (EC, 2023). In the last quarter of 2022, real GDP was 10.3 per cent higher than its pre-pandemic level. The European Commission’s ‘2023 Country Report – Croatia’ (EC, 2023) finds that Croatia had fully recovered from the pandemic, strengthened its resilience and competitiveness and is making good progress in accelerating the digital and green transition with the help of the EU’s resilience and recovery plan. This plan supports investments by providing €5.51 billion in grants, equivalent of 9.5 per cent of Croatia’s 2021 GDP. These grants are tied to economic reforms that should significantly boost potential GDP and put the country on a path to a green future.
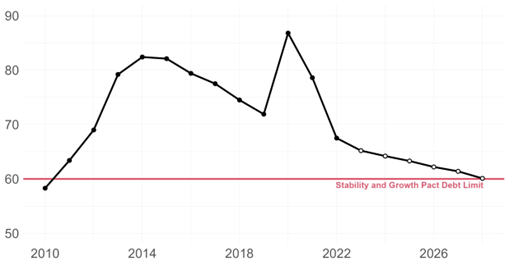
Fiscal governance is another area where Croatia has improved in recent years. Not accounting for the pandemic-induced exogenous shock to the economy, Croatia’s primary balance has been positive since 2016 and is projected to turn positive again in 2024 (Figure 13). The debt ratio has also been on a declining trend since 2014, only spiking back up in 2020. The debt ratio is projected to reach the 60 per cent SGP limit by 2028 (Figure 14).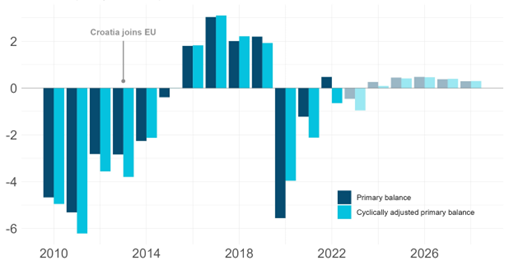
Although many inefficiencies and structural problems remain in the Croatian economy, good fiscal governance, structural reforms and better crisis management methods in the EU make it highly unlikely that Croatia will go down the same path as Greece did.
Reforms to the monetary framework have made the euro area more resilient, boosted its crisis management methods and have been vital to prevent macro-economic imbalances from forming in the first place. However, debt levels remain dangerously high, and the ECB has tightened monetary policy to bring down inflation in accordance with its price stability mandate. This high-interest, high-debt environment constrains fiscal policy to make long-term climate investments. This article has analysed Greek debt dynamics to showcase the consequences of ineffective fiscal rules that are too constraining in times of economic downturns and fail to enforce prudent fiscal policy during economic upturns. Although the euro area has become progressively more resilient, and Croatia – as the newest member to the EMU – is very unlikely to go down the path of Greece, high-debt ratios remain a potent threat to stability. Adoption of fiscal standards and strengthening the role of IFIs in the monetary union would improve fiscal governance and reduce the risk of a future debt crisis.
AMECO (European Commission) (2023), Annual macro-economic database of the European Commission's Directorate General for Economic and Financial Affairs, available at: https://dashboard.tech.ec.europa.eu/qs_digit_dashboard_mt/public/sense/app/667e9fba-eea7-4d17-abf0-ef20f6994336/sheet/f38b3b42-402c-44a8-9264-9d422233add2/state/analysis/, accessed 4 September 2023
Beetsma, R. (2023), ‘EU independent fiscal institutions deserve a stronger role’, Centre for Economic Policy Research, 12 July, available at: https://cepr.org/voxeu/columns/eu-independent-fiscal-institutions-deserve-stronger-role
Bindseil, U., Corsi, M., Sahel, B. and Visser, A. (2017), The Eurosystem collateral framework explained. ECB Occasional Paper No. 189, Frankfurt am Main: European Central Bank
Blanchard, O., Leandro, A. and Zettelmeyer, J. (2021), ‘Redesigning EU fiscal rules: From rules to standards’, Economic Policy, 36 (106), 195–236.
Carlin, W. and Soskice, D. (2015), Macroeconomics: Institutions, instability, and the financial system. Oxford: Oxford University Press
Checherita-Wesphal, C., Hauptmeier, S. and Leiner-Killinger, N. (2022), ‘The euro area in between crises? Considerations on fiscal policies and rules’, Intereconomics, 57 (5), 278–82
De Grauwe, P. (2023), ‘The end of euro area crises?’, in Corsetti, G. and G. Hale (eds) The Making of the European Monetary Union: 30 years since the ERM crisis. London: CEPR Press, available at: https://cepr.org/publications/books-and-reports/making-european-monetary-union-30-years-erm-crisis
European Central Bank (ECB) (2022), Convergence Report, available at: https://www.ecb.europa.eu/pub/convergence/html/ecb.cr202206~e0fe4e1874.en.html
European Central Bank (ECB) (2023), Statistical data warehouse. Available at: https://sdw.ecb.europa.eu/home.do, accessed 13 September 2023
European Commission (EC) (2022a), Convergence Report. Institutional Paper No. 179, available at: https://economy-finance.ec.europa.eu/publications/convergence-report-2022_en
European Commission (EC) (2022b), Fiscal Sustainability Report 2021, Directorate General Economics and Financial Affairs. Institutional Paper No. 171, available at: https://economy-finance.ec.europa.eu/publications/fiscal-sustainability-report-2021_en
European Commission (EC) (2023), 2023 Country Report – Croatia. European Commission staff working document No. 611, available at: https://economy-finance.ec.europa.eu/publications/2023-country-report-croatia_en
International Monetary Fund (IMF) (2023), World economic outlook database, available at: https://www.imf.org/en/Publications/WEO/weo-database/2023/April, accessed 10 October 2023
Investing.com (2023), Available at: https://www.investing.com, accessed 13 October 2023
Lane, P. (2021), ‘The resilience of the euro’, Journal of Economic Perspectives, 35 (2), 3-22
Rawdanowicz, Ł., Turban, S., Haas, J., Crowe, D. and Millot, V. (2021), Constraints and demands on public finances: Considerations of resilient fiscal policy. OECD Economics Department Working Paper No.1694, available at: https://one.oecd.org/document/ECO/WKP(2021)45/En/pdf
Rose, A. (2023), ‘One good reason we were optimistic: The rise of inflation targeting and the demise of fixed exchange rate crises’, in Corsetti, G. and G. Hale (eds) The making of the European Monetary Union: 30 years since the ERM crisis. London: CEPR Press, available at: https://cepr.org/publications/books-and-reports/making-european-monetary-union-30-years-erm-crisis, accessed 6 August 2023
World Bank (2023), World Bank Open Data. Available at: https://data.worldbank.org, accessed 28 September 2023
World Government Bonds (2023), Available at: http://www.worldgovernmentbonds.com, accessed 13 October 2023
Bond market: Financial market tapped by governments to issue debt
Credit crunch: Sudden decline in credit availability
Deficit bias: Preference towards running fiscal deficits
Eurosystem: The monetary authority of the euro area
Eurozone: The economic region of those EU countries that adopted the euro
Fiscal balance: Difference between government revenue and expenditure
Fisher rule: Formula expressing the relationship between nominal interest rates, real interest rates and inflation
Haircut: Reduction to the value of an asset used as collateral to reflect the underlying risk of that asset
OECD: Forum of mostly high-income developed economies
Prisoner’s dilemma: A situation in game theory where the actions of two agents result in a sub-optimal outcome for both
Schengen area: EU countries that have committed to the free movement of people across borders
Stochastic techniques: Modelling techniques that account for random elements to account for the inherent uncertainty in future developments
Asymmetric shocks: Economic shocks that affect different regions or industries in an irregular way
Twin crises: The simultaneous occurrence of banking crises and currency crises
Weighted average maturity: The average maturity of a portfolio weighted by the composition of that portfolio
To cite this paper please use the following details: Küenburg, A. (2024), 'Towards a European Framework for Fiscal Standards: Data Collection, Description and Institutional Analysis’, Reinvention: an International Journal of Undergraduate Research, Volume 17, Issue 1, https://reinventionjournal.org/article/view/1460. Date accessed [insert date]. If you cite this article or use it in any teaching or other related activities please let us know by e-mailing us at Reinventionjournal@warwick.ac.uk.